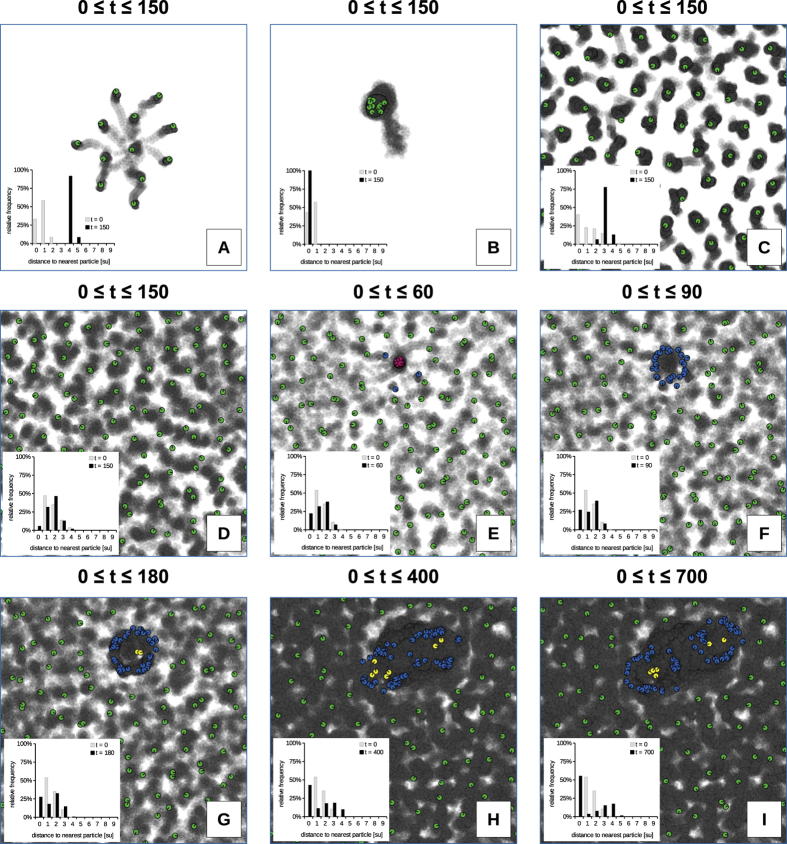
Figure 2. Collective behaviors of different particle numbers and densities.
(A) 12 particles initially arranged around the habitat center. (B) 14 particles initially arranged around the habitat center. (C) Habitat filled with a density of DPE = 0.04 p/su. (D) Habitat filled with a density of DPE = 0.07 p/su. Subfigures (A–D) ran for 150 time steps. (E–I) Habitat filled with a density of DPE = 0.09 p/su at time steps t Semi-transparent grey background stamping shows older positions of particles, thus indicating trajectories of particles and (by their darkness) also past occupancy of areas. Other colors show local density of particles at the final time step, according to the color scheme indicated in the Method section and in Fig. 3. Each subgraph holds also a histogram of initial nearest-neighbor distances of particles and the final nearest-neighbor distance distribution at the end of the run in distance classes 1 space unit wide (1st class: 0.00–0.99, 2nd class: 1.00–1.99, …, 10th class: 9.00–9.99).

