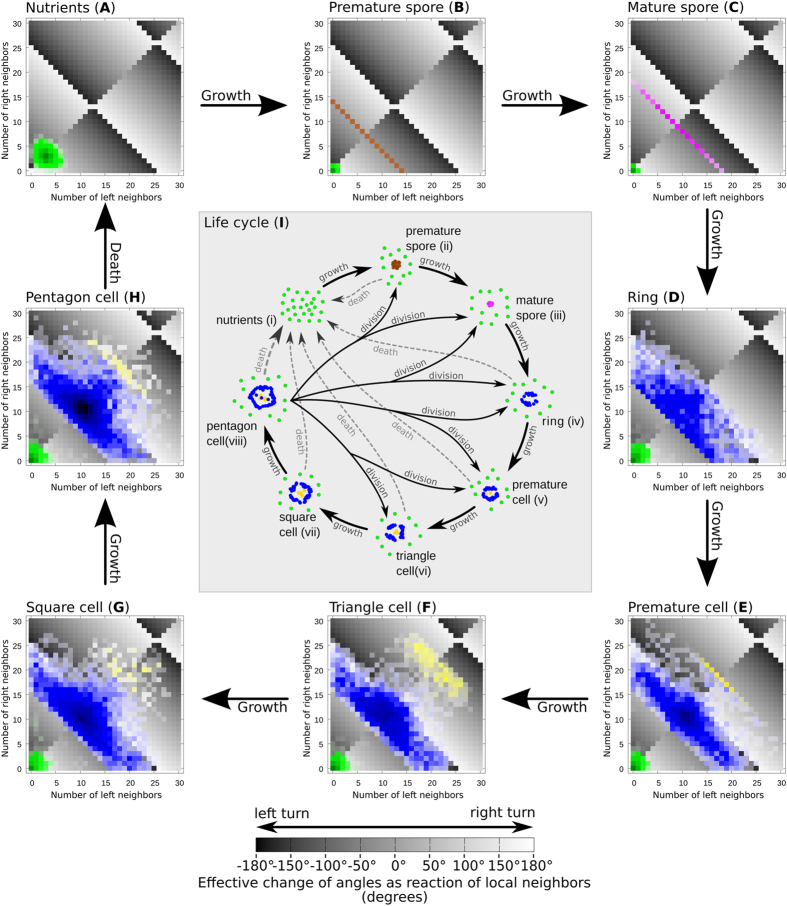
Figure 4.
Heat maps in phase diagrams showing the time spent by particle in configurations with specific left-to-right (Lt,r:Rt,r) local neighborhood sizes within radius r = 5 (subfigures A–H). This determines particles’ rotation behavior (bright background: right turn, dark background: left turn) in our PPS. We observed particles building typical shapes in our PPS for 100 steps and display their overall turning regimes as a heat map so that the darker colors indicate higher frequency of these neighboring conditions, thus also higher frequency of this specific turning behavior. Characteristic structures reside for mostly in very specific neighborhood conditions. This suggests that the observed structures are self-stabilizing in a homeostatic way over long periods of time. Central subfigure (I): Resulting typical life-cycle of structures in PPS = 〈r = 5, α = 180°, β = 17°, v = 0.67〉.

