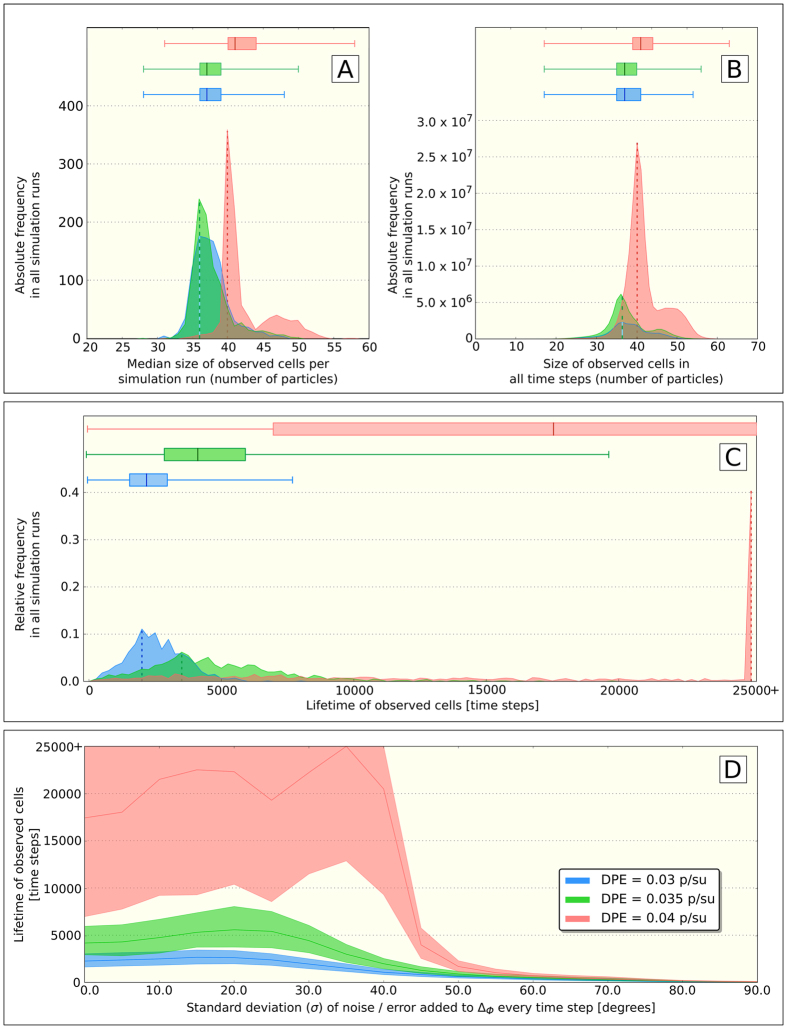
Figure 6. Further analysis of cell properties in dependence of environmental nutrient particle density (DPE = density of green particles in the environment) and in dependence of actuation noise/error.
(A) Histogram of median effects of environmental particle density on the resulting size-distribution of cells within individual simulation runs (which were stopped when cells died). (B) Histogram of absolute effects of environmental particle density on the resulting size-distribution of cells across all performed simulation runs. (C) Histogram of effects of environmental particle density on the absolute survival (maximum lifetime) of cells across all simulation runs that lasted for 25,000 time steps. Colored areas show histograms of observed distribution, vertical dashed lines the most common observation (modus). Horizontal box-blots indicate minimum, maximum, quartiles and medians of the observed distributions. (D) Median (solid line) and IQR (filled areas) of effect of environmental density and actuation error (noise) on the observed lifetime of cells.

