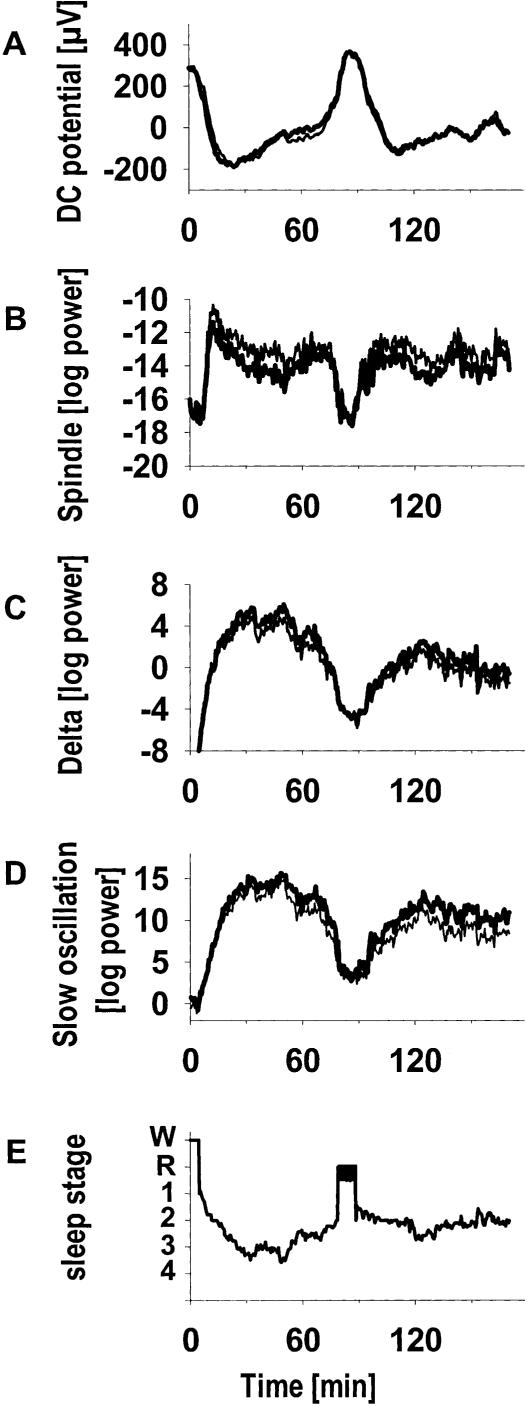
Figure 2.
Changes in (A) the direct current (DC) potential, in power in the (B) spindle, (C) delta and (D) slow oscillation EEG frequency bands, and (E) in sleep stages, shown for the first 3 h of sleep. Graphs represent means from nine subjects, time locked to sleep onset and periods of REM sleep. Note that transition into SWS is marked by a pronounced negative DC-potential shift followed by a slight decline in this negativity during SWS. This course is paralleled by strong increases in spindle, delta, and slow oscillation power at the passage into SWS followed by a slight decrease during SWS. Within individual nights, DC potential negativity and spindle as well as slow oscillatory power were strongly correlated (average r > 0.80). Modified with permission from Elsevier © 2003, Marshall et al. 2003.

