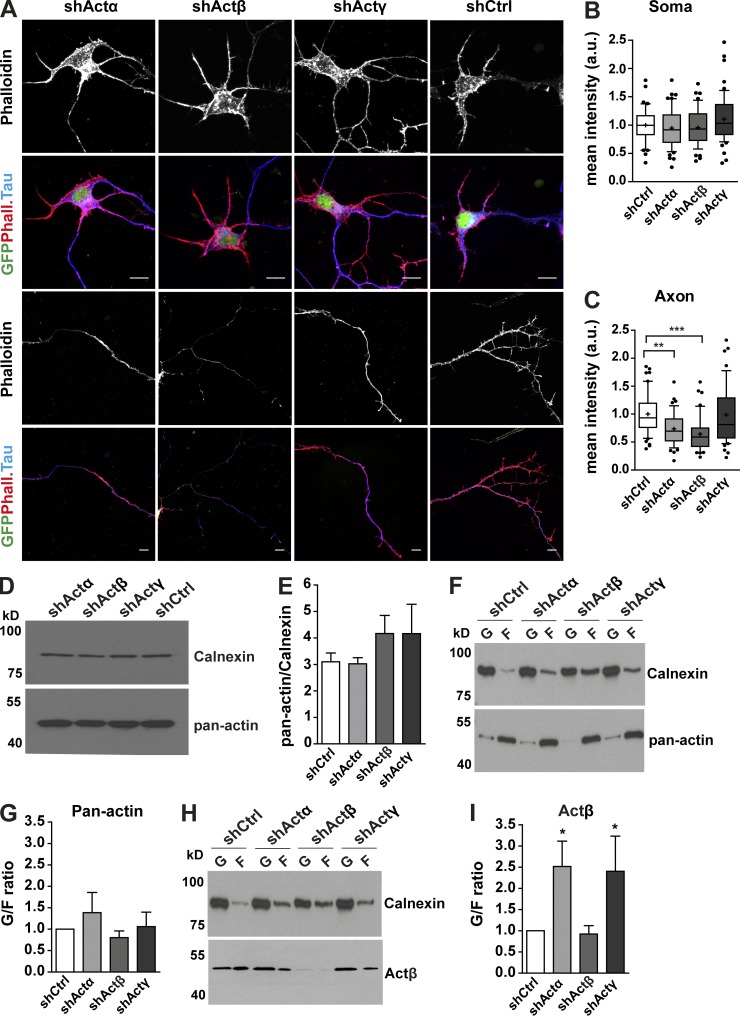
Figure 8.
Depletion of Actα and Actβ affects F-actin polymerization in axons. (A) Motoneurons transduced with respective shRNAs against actin isoforms were fixed and stained with phalloidin and against Tau. Mean intensity of phalloidin staining was measured and normalized to mean intensity of phalloidin in shCtrl group. (B) In the soma, phalloidin intensity is not altered (P < 0.208 for n = 3; sample size: shActα: 55, shActβ: 47, shActγ: 53, shCtrl: 44 cells). (C) Phalloidin intensity is reduced in axons after knockdown of Actα and Actβ (**, P < 0.0018 for shActα; ***, P < 0.0001 for shActβ for n = 3; sample size: shActα: 48, shActβ: 46, shActγ: 53, shCtrl: 54 cells). Bars, 10 µm. (D) Western blot analysis of lysates from actin isoform–specific knockdown motoneuron cultures probed with pan–actin antibody (n = 4). (E) Total actin levels remain constant after depletion of each actin isoform. (F) Immunoblots of supernatant (G-actin) and pellet fractions (F-actin) of motoneuron lysates after ultracentrifugation probed with pan–actin antibody. (G) Quantification shows no change in the G- to F-actin ratio after depletion of individual actin isoforms (n = 5). (H) Supernatant and pellet fractions of motoneuron lysates were labeled with Actβ antibody. (I) Quantification of the G- to F-actin ratio shows increased levels of Actβ in the G-actin pool after knockdown of Actα and Actγ (*, P < 0.016 for n = 5). Statistical analysis was done using one-way ANOVA with Dunn’s post-test (B–E) or one-tailed Mann–Whitney test (G and I). In E–I, data are shown as mean ± SEM.

