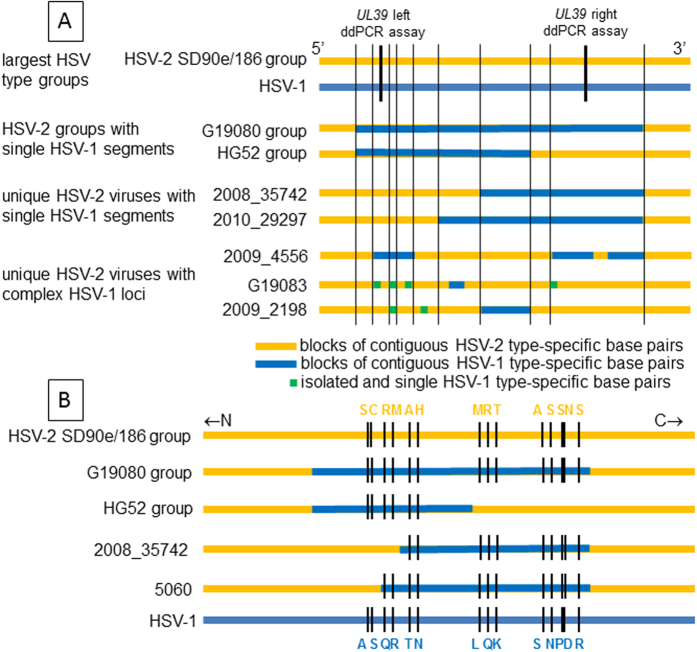
Figure 2. HSV UL39 variants in circulating strains.
Horizontal lines represent C-terminal UL39 sequences to approximate scale. Group and virus names at left. (A) Genotypes. At top, the largest HSV-2 clade similar to strains SD90e and 186 (top) is yellow and the HSV-1 group is blue. Within IRV, blue bars represent zones of 4 or more contiguous HSV-1 variant SNPs. Green spots are isolated SNPs containing one HSV-1 variant nucleotide. Thin vertical black lines represent short crossover zones indistinguishable between HSV genotypes. Thick vertical black lines show approximate locations of type-specific ddPCR genotyping assays. (B) Amino acid variations in selected groups and viruses. Strains SD90e and 186 (top) are yellow and HSV-1 group (bottom) is blue. Blue bars in IRV represent zones of contiguous SNPS with HSV-1 variant nucleotides. Short black lines represent locations of color coded amino acid differences between strains.

