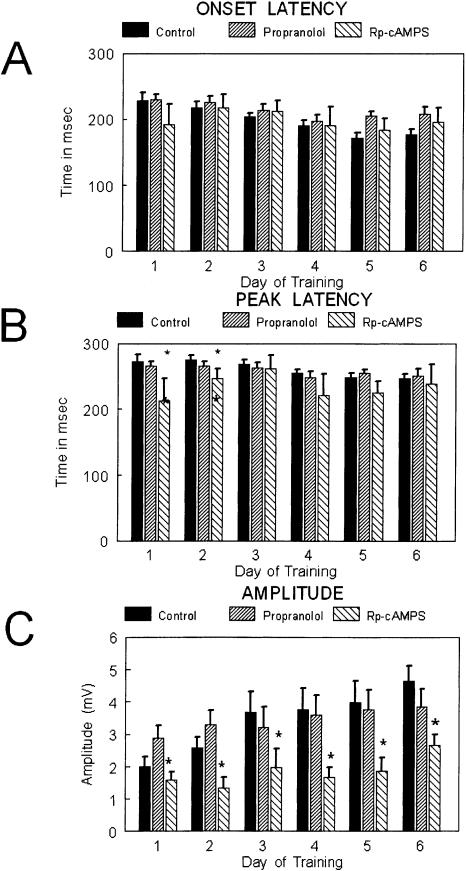
Figure 2.
Bar graphs showing (A) onset latency, (B) peak latency, and (C) amplitude of the conditioned responses over days of training for the three groups: control (solid bars; n = 13), propranolol (upward slashed; n = 12), and Rp-cAMPS (downward slashed; n = 5). The statistical comparisons are presented in the text. No differences were observed between groups for onset latency. Peak latency was shorter for the Rp-cAMPS group on days 1 and 2. Amplitude of the CR was lower for the Rp-cAMPS group across all days of training.

