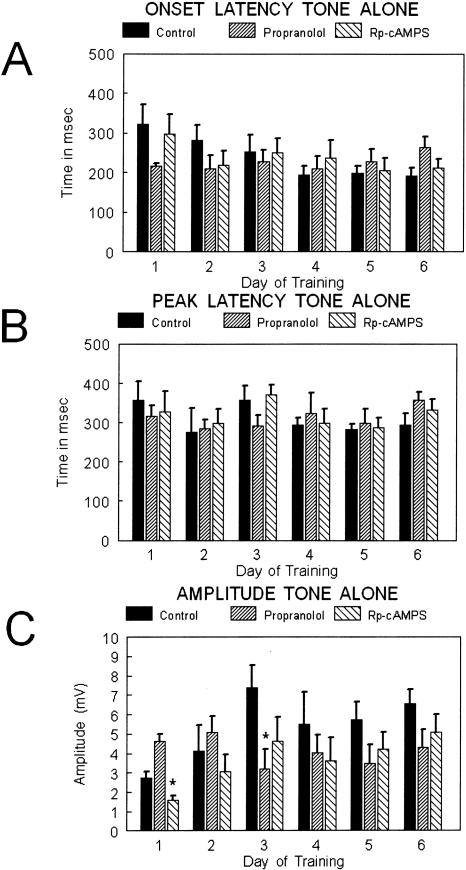
Figure 3.
Bar graphs showing (A) onset latency, (B) peak latency, and (C) amplitude of the conditioned responses for the tone alone trials over days of training for the three groups: control (solid bars; n = 6), propranolol (upward slashed; n = 12), and Rp-cAMPS (downward slashed; n = 5). The statistical comparisons are presented in the text. No differences were observed between groups for onset latency or peak latency. The amplitude was higher for propranolol rats on day 1 compared with the Rp-cAMPS group, and on day 3 the amplitude for propranolol was significantly lower than control.

