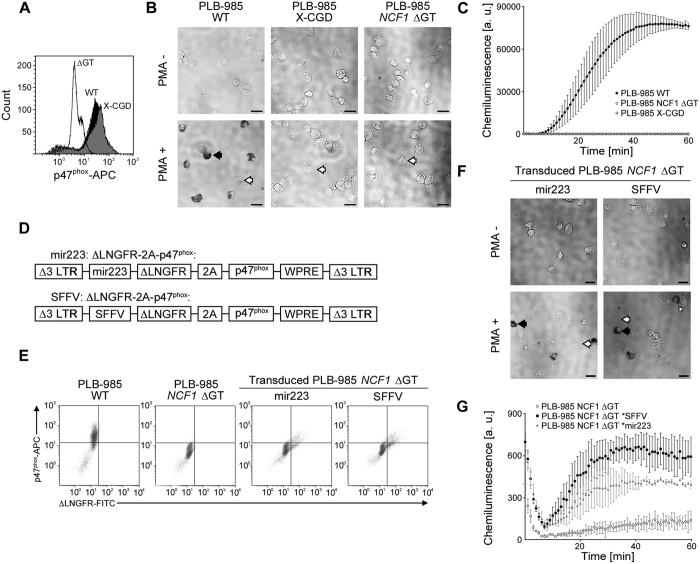
Figure 2. Superoxide production in PLB-985 NCF1 ΔGT.
(A) p47phox flow cytometry analysis and(B) ROS production in granulocytically differentiated PLB-985, PLB-985 X-CGD and PLB-985 NCF1 ΔGT cells measured by NBT test. NBT-positive: black arrow; NBT-negative: white arrows. Scale bar: 25 μm.(C) Chemiluminescence assay of un-transduced PLB-985 WT, PLB-985 NCF1 ΔGT, and PLB-985 X-CGD cell line (mean and standard deviation of mean, n = 3, a.u. = arbitrary units). (D) γ-retroviral vectors for reconstitution of p47phox expression. (E) Flow cytometry analysis of p47phox and ΔLNGFR expression in differentiated un-transduced PLB-985 WT and PLB-985 NCF1 ΔGT, and transduced PLB-985 NCF1 ΔGT cells. (F) ROS production in transduced PLB-985 NCF1 ΔGT cells upon differentiation, measured by NBT test. NBT-positive: black arrow; NBT-negative: white arrows. Scale bar: 25 μm. (G) Chemiluminescence assay of transduced PLB-985 NCF1 ΔGT cells (mean and standard deviation of mean, n = 3).

