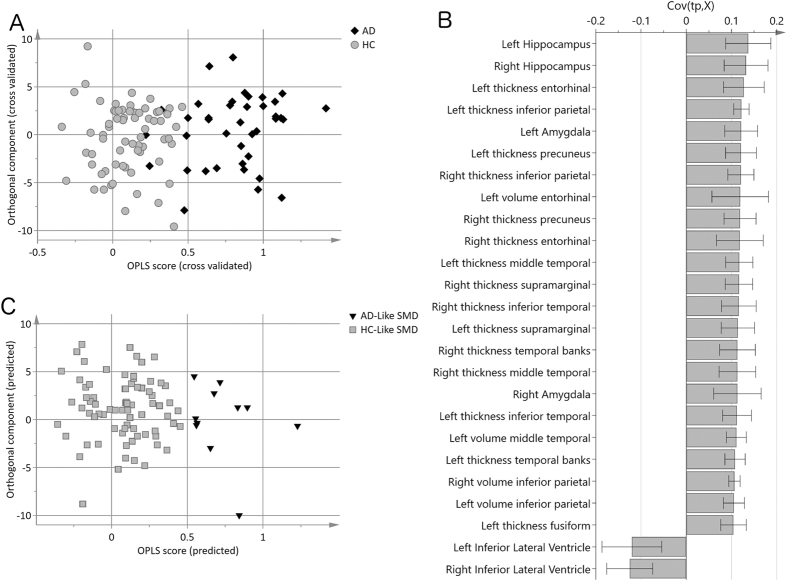
Figure 1. Multivariate classification of SMD individuals based on patterns of brain atrophy.
(A) Cross-validated scores of Alzheimer’s disease (AD) patients versus healthy controls (HC). Cross-validated predictability Q2(Y) was 0.72 and sensitivity and specificity values were 84% and 100%, respectively. (B) Loading plot of the twenty-five most important variables for AD versus HC classification. A measure with a high covariance (y-axis) is more likely to have an impact on group separation than a measure with a low covariance. Measures above zero have a larger value in controls, including hippocampus, entorhinal cortex, inferior parietal cortex, amygdala, precuneus, etc. (i.e. reduced volume or thickness in the AD group), and measures below zero have a lower value in the controls including the lateral ventricles (i.e. larger volume in the AD group). (C) Prediction of SMD individuals. HC = healthy controls; SMD = subjective memory decline; AD = Alzheimer’s disease; HC-like SMD = SMD individuals evidencing a healthy-like pattern of brain atrophy; AD-like SMD = SMD individuals evidencing an AD-like pattern of brain atrophy.

