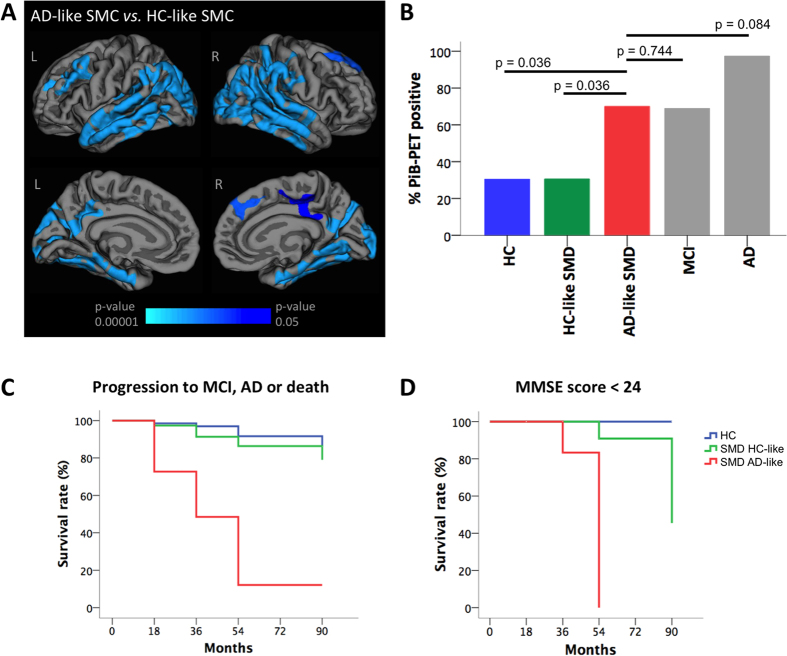
Figure 2. Clinical characterization of the SMD subtypes.
(A) The cortical maps from the vertex analysis shows that AD-like SMD had reduced thickness in the medial and lateral temporal, frontal and parietal cortices as compared with HC-like SMD. Lateral surfaces are displayed in the upper row and medial surfaces are displayed in the bottom row. L = left, R = right. (B) ANCOVA was performed in order to compare the PiB-PET retention in AD-like SMD versus the other study groups. Benjamini-Hochberg’s corrected p-values are displayed in the figure. Age, gender, education level and HADS-D where included as covariates. (C,D) Longitudinal progression of SMD subtypes. In C, outcomes were categorized as stable if individuals remained in the same diagnostic group during the follow-up, or progressive if they developed MCI or dementia or died at the follow-up. In D, performance in MMSE was categorized as normal (≥24) or abnormal (<24). Survival was considered when SMD individuals remained stable (C) or showed a MMSE score ≥24 (D). HC = healthy controls; SMD = subjective memory decline; MCI = Mild Cognitive Impairment; AD = Alzheimer’s disease; HC-like SMD = SMD individuals evidencing a healthy-like pattern of brain atrophy; AD-like SMD = SMD individuals evidencing an AD-like pattern of brain atrophy; PiB-PET = Pittsburgh compound B–positron emission tomography.

