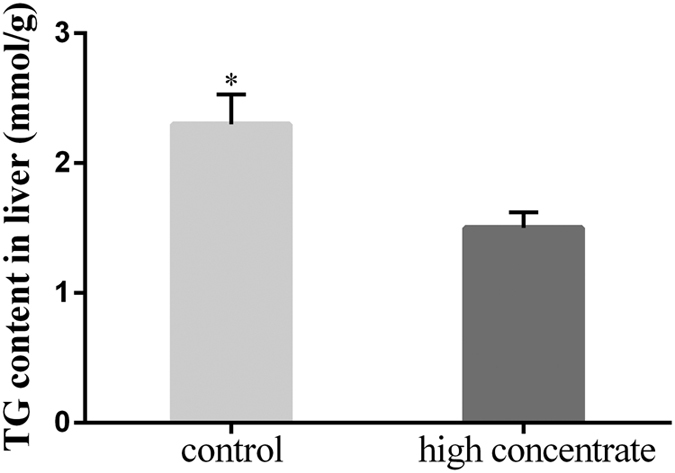
Figure 1. Effect of an HC diet on the TG contents in the livers of lactating cows.

Quantification of the liver TG content by biochemical analysis. Data are presented as the means ± SEM (n = 5/group). *p < 0.05 indicates statistically significant differences when compared with the control group.
