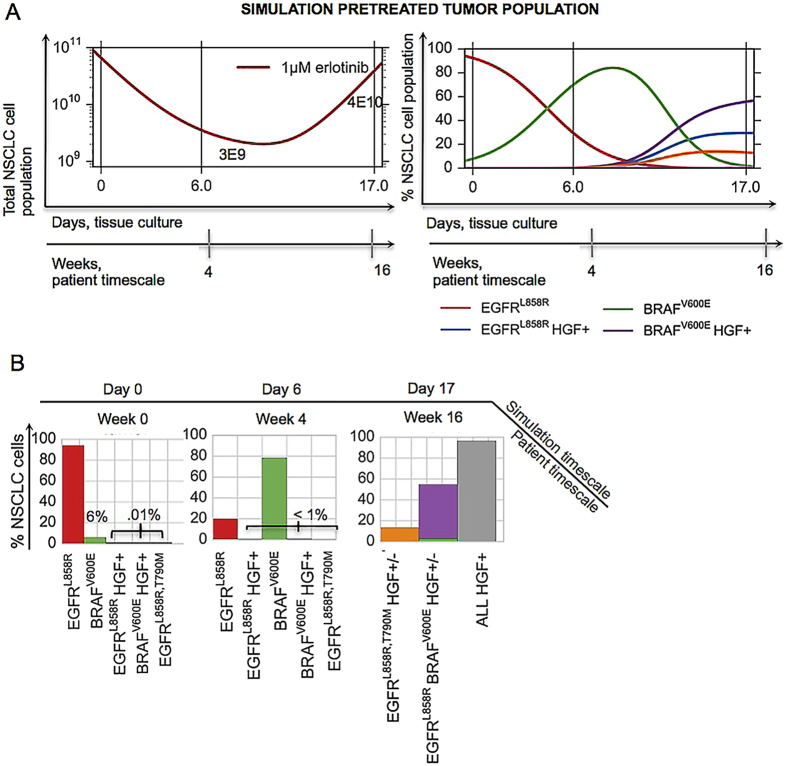
Figure 2. Mathematical simulation qualitatively captures the patient’s evolution on erlotinib.
(A) A simulation of the mathematical model of lung adenocarcinoma evolution (SI, Equation (S1)) in the presence of 1 μM erlotinib, given the patient-derived pretreatment initial tumor cell subpopulations (94% EGFRL858R, 6% BRAF V600E, 0.01% MET amplification of EGFRL858R, BRAFV600E and EGFRT790M). Parameters used in the simulation were derived from growth and viability assays of parental 11–18 EGFRL858R-positive lung adenocarcinoma cells or those cells engineered to express mutations listed above and treated with 0 or 50 ng/ml HGF, in the presence of varying concentrations of erlotinib and fit according to Equations S8, S9 and S11. (B) Tumor cell populations present at day 0, 6 and 17 of the simulation in (A), including the total HGF+ cell population at day 17 (gray). The model qualitatively captures a possible evolutionary trajectory and results in a similar final tumor cell composition as that of the patient, (B) day 17 vs. Fig. 1(B and C).

