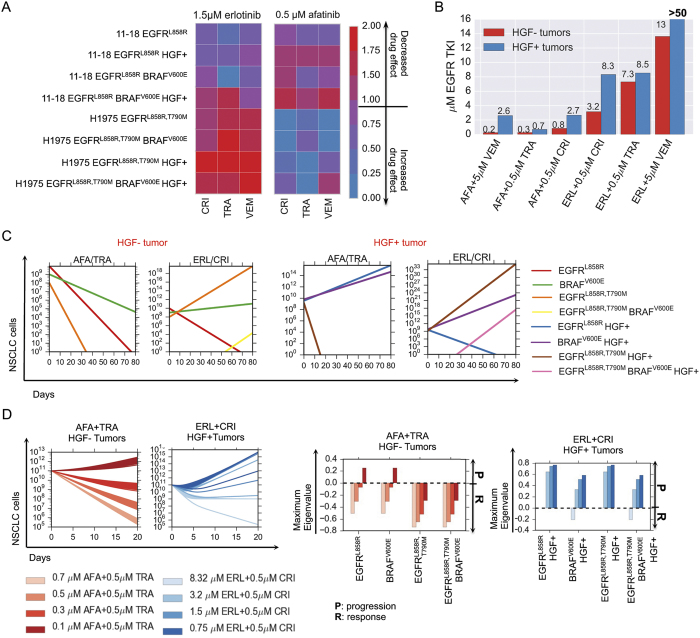
Figure 3. Modeling pharmacodyamic effects of concurrent BRAFV600E expression and MET activation in EGFR-mutant lung adenocarcinoma cells and their implication on progression.
(A) Drug efficacy as measured by the effect of 1.5 μM erlotinib or 0.5 μM afatinib in combination with either 0.5 μM MET inhibitor crizotinib, 0.5 μM MEK inhibitor trametinib or 5 μM BRAF inhibitor vemurafenib on cell growth (SI, Equation S1) of parental 11–18 EGFRL858R-positive lung adenocarcinoma cells or those cells engineered to express mutations listed above and treated with 0 or 50 ng/ml HGF. (B) Concentrations of EGFR TKIs afatinib and erlotinib in combination with either 0.5 μM crizotinib, 0.5 μM trametinib or 5 μM vemurafenib that guarantee progression free tumor reduction for any HGF− or HGF+ initial tumor subpopulations according to the model, measured by the minimum concentration of erlotinib or afatinib that results in exponential stability of the evolutionary dynamics model (SI, Section 3.2). (C) Simulations of the lung adenocarcinoma model for combinations of 0.5M afatinib + 0.5 μM trametinib and 1.5 μM erlotinib + 0.5 μM μcrizotinib for the HGF− and HGF+ tumors specified. (D) (Left) Simulations of the evolutionary dynamics of different HGF− lung adenocarcinoma initial tumor subpopulations with a constant treatment of 0.7 μM, 0.5, 0.3 or 0.1 μM afatinib in combination with 0.5 μM of trametinib (red) and of different HGF+ lung adenocarcinoma initial tumor subpopulations with a constant treatment of 8.32 μM, 3.2 μM, 1.5 μM or 0.75 μM erlotinib in combination with 0.5 μM crizotinib (blue). (Right) Maximum eigenvalue decompositions (SI, Section 3.2) classify which subpopulations can lead to progression at different concentrations of EGFR TKI for the afatinib + trametinib combination and the erlotinib + crizotinib combination.

