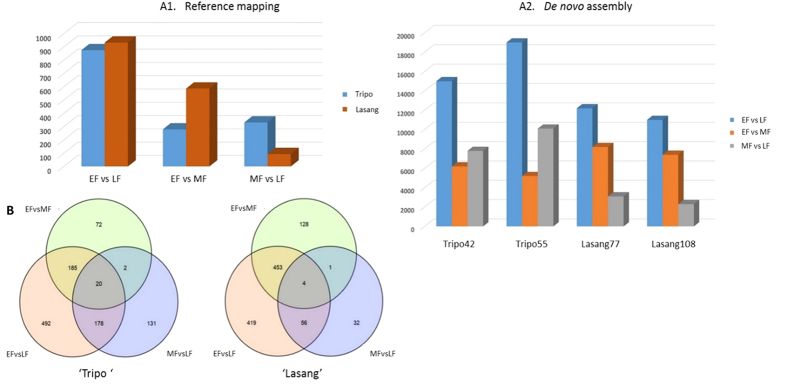
Figure 2.
The number of differentially expressed transcripts identified using reference based assembly (A1) and de novo based assembly (A2). (B) Venn diagrams represents the number of up- and down-regulated transcripts that were common and specific for the pairwise comparisons using the reference based assembly in pairwise comparisons between EF vs LF (early vs. late flowering), EF vs MF (early vs. mid flowering), and MF vs LF (mid vs. late flowering) in genotypes ‘Tripo’ and ‘Lasang’ using a false discovery rate (FDR) of <0.05.

