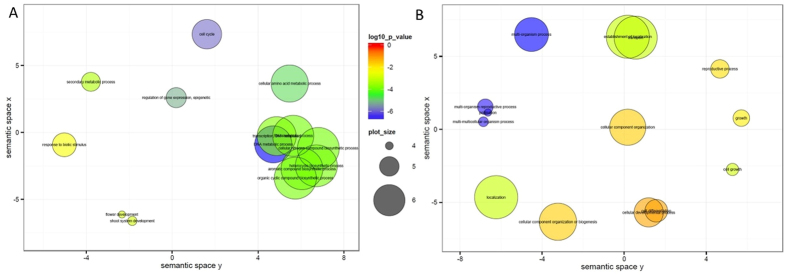
Figure 5. Gene ontology (GO) enrichment analysis by Fischer’s exact test.
The scatterplot of GO terms which are associated with differentially expressed genes in ‘Tripo’ (A) and in ‘Lasang’ (B) shows the cluster representatives (i.e. terms remaining after the redundancy reduction) in a two dimensional space derived by applying multidimensional scaling to a matrix of the GO terms’ semantic similarities. Bubble color indicates p-value (-log10 p-value); size indicates the frequency of the GO term in the underlying GOA database (bubbles of more general terms are larger). In ‘Tripo’ (low seed yield) (A) has higher representation of GO of flower and shoot system development. In ‘Lasang’ (high seed yield) (B) has higher representation of GO for pollination or pollen-pistel interactions (multi-organism process).

