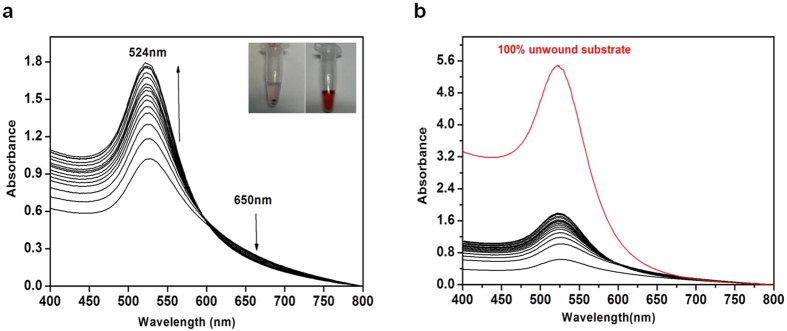
Figure 3.
(a) Surface Plasmon Resonance curves of the reaction mixture (helicase buffer with substrate, enzyme and ATP) as a function of time. The inset shows the colour of the substrate before and after enzyme addition. (b) The SPR graph curve of the 100% unwound substrate as compared with the curves obtained as a result of the enzymatic reaction.

