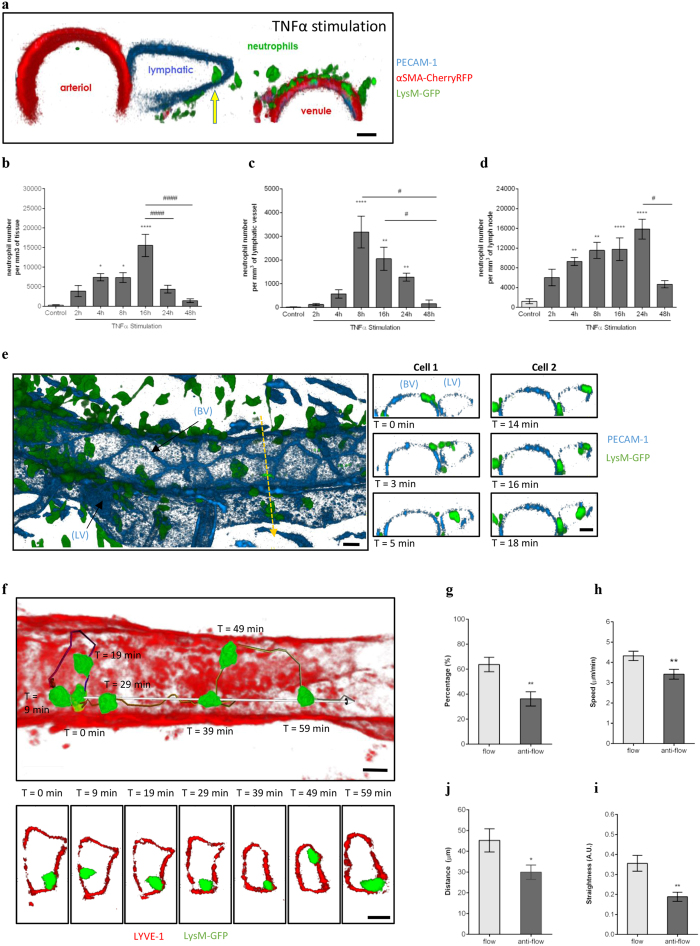
Figure 1. Dynamics of neutrophil migration into cremaster muscle lymphatics upon TNFα-stimulation.
The dynamics of neutrophil migration into the tissue and lymphatic vessels was analysed by intravital confocal microscopy in TNFα-stimulated mouse cremaster muscles. (a) Representative 3D-reconstructed still image (2 μm cross-section) from a LysM-GFP × αSMA-CherryRFP mouse [exhibiting both endogenous GFP-fluorescent neutrophils (green) and RFP-fluorescent pericytes/smooth muscle cells (red) and immunostained with a non-blocking anti-PECAM-1 mAb (blue)] cremaster tissue showing a neutrophil within the lymphatic vessel (yellow arrow) post TNFα-stimulation. (b) Time-course of neutrophil extravasation in TNFα-stimulated cremaster muscles. (c) Time-course of neutrophil migration into lymphatic vessels upon TNFα-stimulation. (d) Total neutrophil-infiltrate in dLNs upon TNFα-stimulation. (e) Representative 3D-reconstructed still image of a post-capillary venule and an adjacent lymphatic vessel from a LysM-GFP mouse (immunostained with non-blocking anti-PECAM-1 mAb (blue)]. The right panel images illustrate a time-lapse series of 2 μm-thick cross-sections along the z-plane (dotted-yellow arrow) showing the migration of two neutrophils (Cell-1 & Cell-2) into the lymphatic vessel. (f) Representative 3D-reconstructed still image of a lymphatic vessel from a TNFα-stimulated cremaster tissue of a LysM-GFP mouse and immunostained with an anti-LYVE-1 mAb (red) in vivo. Neutrophil crawling path (colour-coded line) and directionality (white arrow) is shown on the image. The bottom panel images are a series of high magnification cross-sections of the main image at indicated time-points illustrating the continuous attachment of the neutrophil to the lymphatic endothelium. (g) Percentage of neutrophils crawling in the afferent direction (flow) or in the opposite direction (anti-flow). Speed (h), directionality (i) and straightness (j) of neutrophils crawling in the afferent (flow) or opposite direction (anti-flow) of the cremaster lymphatic vessels. Data are expressed as mean ± SEM from 5–12 animals per group (at least 5 independent experiments). For the crawling parameter analysis, a total of 63 cells were quantified from 8 mice. Statistically significant differences between stimulated and unstimulated treatment groups are indicated by asterisks: *P < 0.05; **P < 0.01; ***P < 0.001; ****P < 0.0001. Significant differences between responses at different time points are indicated by hash symbols: #P < 0.05; ####P < 0.0001. Bar = 10 μm.

