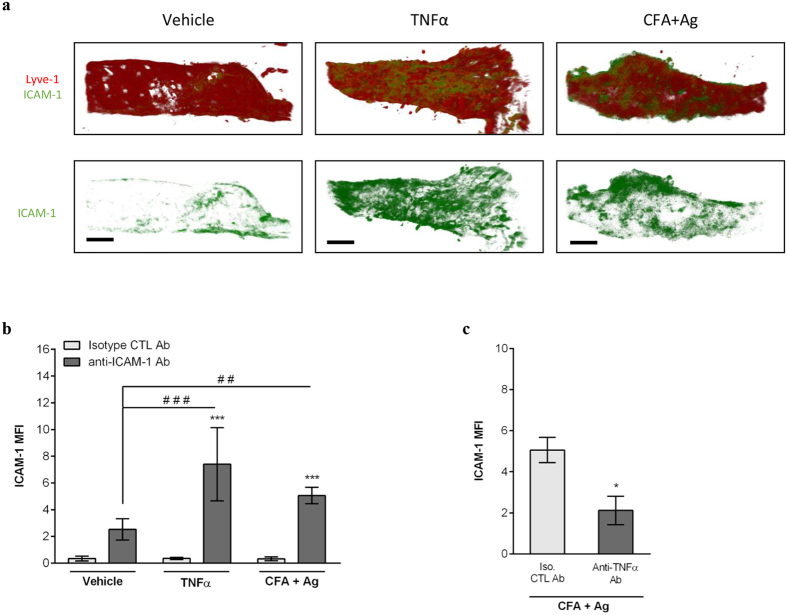
Figure 6. TNFα controls ICAM-1 expression on lymphatic endothelial cells in vivo.
Cremaster muscles of WT mice were stimulated with TNFα or CFA+Ag (6–8 hrs) and immunostained with Alexa555-conjugated anti-LYVE-1 and Alexa488-conjugated anti-ICAM-1 (or an isotype control) mAbs to label the lymphatic vasculature and ICAM-1, respectively. (a) The pictures are representative confocal images of cremaster lymphatic vessels showing the expression of ICAM-1 on selected lymphatic vessels from a PBS-treated control (left panels), TNFα-stimulated (middle panels) and CFA+Ag-stimulated (right panels) animals. (b) ICAM-1 expression (mean fluorescent intensity or MFI) on vessels from PBS-treated control, TNFα-stimulated and CFA+Ag-stimulated cremaster muscles as quantified by IMARIS software. (c) ICAM-1 expression on lymphatic vessels of CFA+Ag-stimulated cremaster muscles from animals pre-treated with an anti- TNFα blocking mAb or isotype CTL mAb injected 4 hrs post-inflammation. Data are expressed as mean ± SEM of N = 8–12 vessels/animals from 4 animals per group (3 independent experiments). Statistically significant differences between the staining of isotype control and anti-ICAM-1 Abs treated groups are indicated by asterisks: *P < 0.05; ****P < 0.0001. Significant differences between unstimulated and inflamed groups are indicated by hash symbols: ##P < 0.01; ####P < 0.0001. Bar = 50 μm.Results are expressed as mean ± SEM of N = 4–9 mice (1–2 vessels analysed/mouse for intravital confocal microscopy, each mice is a single experiment). Significant differences between blocking antibodies treated and control groups are indicated by *P < 0.05; ***P < 0.001; ****P < 0.0001. Significant differences between other groups are indicated by #(P < 0.05). Bar = 30 μm.

