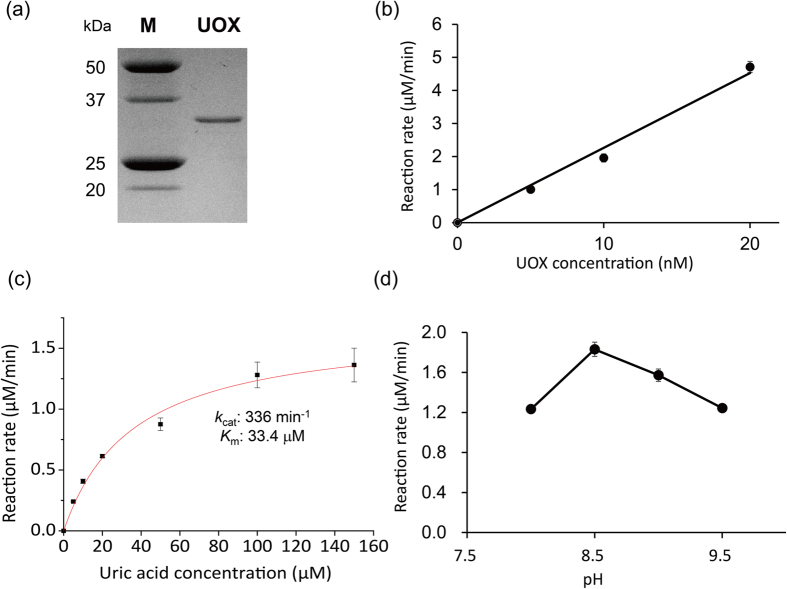
Figure 2. Properties of UOX.
(a) SDS-PAGE gel image of UOX. M and UOX denote lanes for molecular weight markers and purified UOX, respectively. Full-length gel is presented in Supplementary Fig. S1. (b) Reaction rates of at varying UOX concentrations. An appropriate amount of UOX was reacted with 100 μM uric acid in 20 mM borate buffer (pH 9.5). (c) Michaelis–Menten plot of UOX. All reactions were conducted in 20 mM borate buffer (pH 9.5) using 5 nM UOX. (d) Tendency of UOX activity depending on pH. 100 μM uric acid was converted by 5 nM UOX in 20 nM borate buffer at varying pHs. Standard deviations are expressed by error bars.

