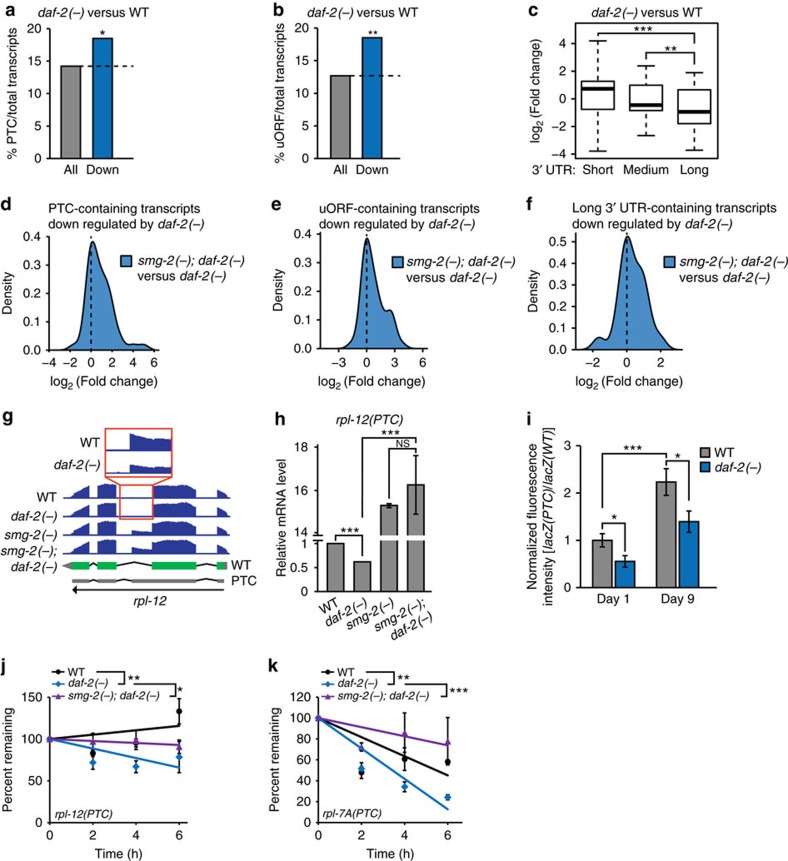
Figure 4. Reduced IIS decreases the levels of NMD targets.
(a,b) The fractions of PTC- (a) or uORF- (b) containing transcripts per total transcripts in daf-2(e1370) (daf-2(−)) compared to WT (Down: log2(fold change)≤−1, P≤0.1, *P<0.05, **P<0.01 χ2-test). See Supplementary Table 1 for actual P values, and Supplementary Data 3 for lists of PTC- and uORF-containing transcripts. (c) Box plots showing the fold changes in daf-2(−) mutants compared to WT for the transcripts containing long, medium or short 3′ UTR lengths. Short (≤350 nt), medium (350 nt<<1,500 nt) and long (≥1,500 nt). 3′ UTR lengths were categorized following a previous report50. Thick black lines indicate median values. Bottom and top of the box plot represent 25th and 75th percentile, respectively, and whiskers indicate the data within the 1.5 interquartile range, which is the distance between the lower and upper quartiles of the data (**P<0.01, ***P<0.001, Wilcox rank-sum test). (d–f) smg-2 dependency analysis of the PTC- (d), uORF- (e) or long 3′ UTR- (f) containing transcripts whose levels were decreased in daf-2(−) mutants compared to WT (Down: log2(fold change)≤−1, P≤0.1). We also analysed NMD targets (uORF-, PTC- and long 3′ UTR-containing transcripts) using smg-1 mutant data13 (Supplementary Fig. 8b,d,f). (g,h) The effects of daf-2(−) and smg-2(−) mutations on the expression level of rpl-12(PTC), an endogenous C. elegans NMD target16, measured by using mRNA sequencing (g) and qRT–PCR (n=2) (h). Green rectangles indicate exons, and grey parts indicate untranslated regions. (i) The fluorescence intensity of lacZ(PTC) was normalized to age- and genotype-matched lacZ(WT). (n≥16 from at least two independent experiments). The same bar graphs for WT control was used in Fig. 1c (two-tailed Student's t-test, *P<0.05, ***P<0.001). (j,k) The mRNA half-lives of C. elegans NMD targets, rpl-12(PTC) (j) and rpl-7A(PTC) (k), in adult worms (n=3). P values were calculated by using two-way ANOVA test (*P<0.05, **P<0.01, ***P<0.001). See Supplementary Fig. 10 for the optimization of RNA half-life assays in C. elegans. Error bars represent s.e.m.

