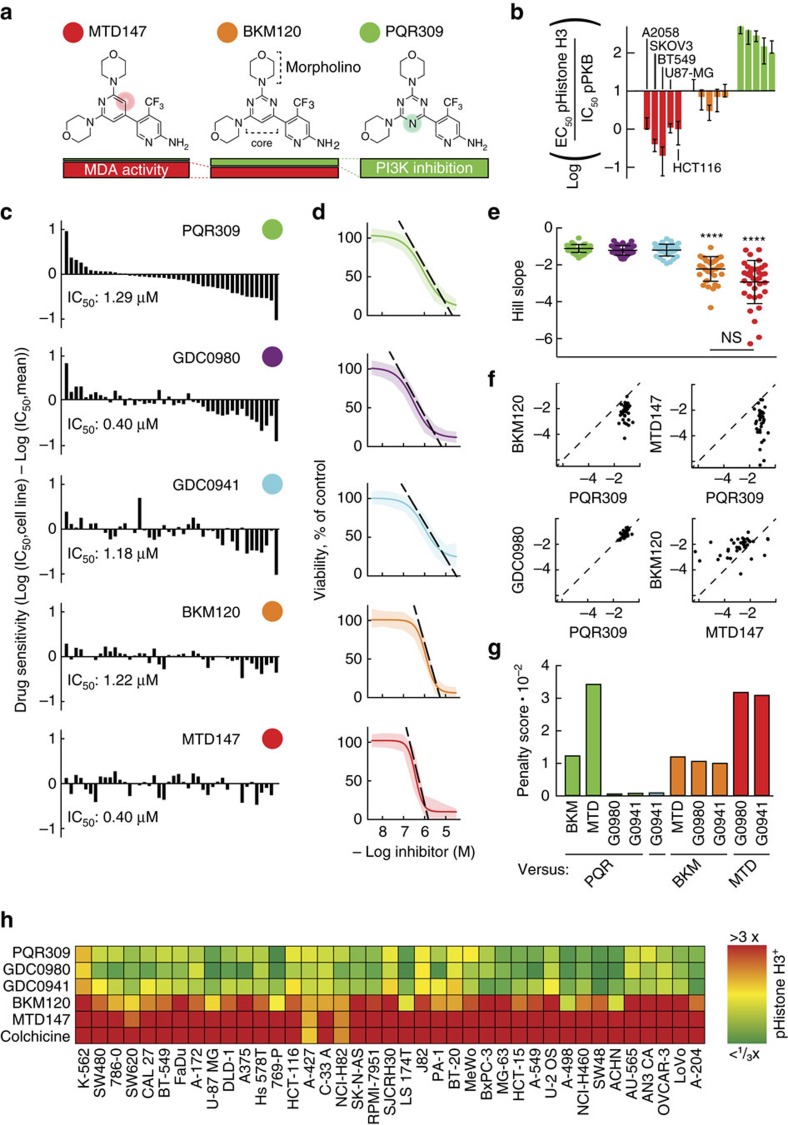
Figure 1. Splitting BKM120's inherent biological activities.
(a) Exchange of BKM120's pyrimidine core with pyridine yields MTD147; a triazine core is present in PQR309. Rectangles below chemical formulas schematically indicate microtubule-destabilizing agent (MDA, red) and PI3K (green) inhibitor activities. (b) Ratios of cellular MDA activity (EC50 pHistone H3) over PI3K inhibition (IC50 pPKB; compounds colour-coded as in a) were determined for the indicated cell lines (EC50 of phospho-Histone H3 for PQR309 was set to 20 μM due to the absence of response; for values see Supplementary Materials: Supplementary Fig. 1a,b and Supplementary Fig. 1i–m). PI3K inhibition was assessed by phosphorylation of Akt/PKB (Supplementary Fig. 1a), MDA activity by high-content microscopy detecting phospho-Histone H3 (Supplementary Fig. 1b) and nuclear DNA condensation (Supplementary Fig. 1c), and was correlated with proliferation (Supplementary Fig. 1d). (c) Drug sensitivity of 44 cell lines exposed to indicated compounds. Individual IC50s of cell line growth were related to the mean IC50 of all cells lines, and cell lines were sorted by lowest to highest sensitivity for PQR309 from left to right (for values and cell lines see Supplementary Tables 1,2; mean of duplicate experiments of a 9-point serial drug dilution for each cell line). (d) Dose–response curves for cell viability: displayed are of dose–response curves averaged over all 44 cell lines (n=88 (duplicates of 44 cell lines), mean±s.e.m.; colour code as in c). Hill slopes are indicated as dashed black lines. (e) Hill slope values of individual cell line viability curves (drugs added coloured as in c; ****depict P<0.0001 (Friedmann's test with Dunn's multiple comparison) for comparison with PQR309, GDC0980, GDC0941). Indicated values are mean±s.d. (f) Cross-correlation of cell lines' Hill slopes of indicated drug pairs. Dashed lines reflect the Hill slope ratio of 1 (for more results see Supplementary Fig. 1o). (g) Cross-correlation penalty score calculations based on Hill Slopes (see Methods). (h) Heat map depicting drug-induced fold changes of phospho-Histone H3-positive cells 24 h after drug treatment (all compounds at 2 μM; colchicine 200 nM) as compared to DMSO. Cell lines are sorted according to sensitivity to PQR309 (n=6 for K562 and LS174-T n=3). An overview of chemical formulas of relevant compounds is provided in Supplementary Fig. 1p. NS, nonsignificant.

