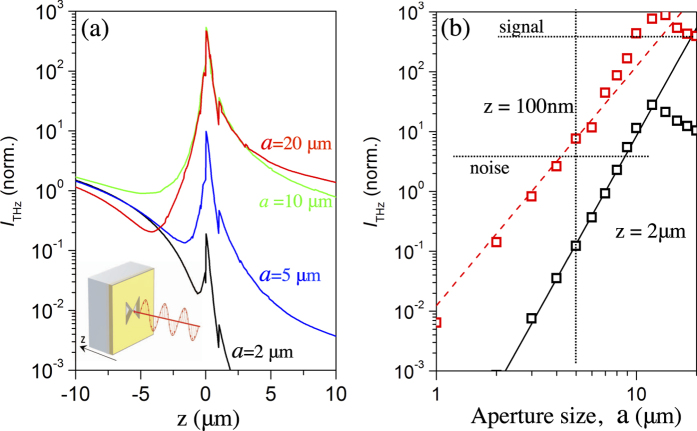
Figure 5. Numerical simulation of the THz field in the aperture region.
(a) THz intensity (ITHz∝|E|2, where E is the electric field) along the optical axis passing through the center of 2, 5, 10 and 20 μm apertures and the source-gate gap of 500 nm. (b) ITHz at the detector position, z = 100 nm (red curve), for apertures ranging from 1–20 μm, compared to the ITHz (black curve) at z = 2 μm. The red dashed line and the black solid line show the a4 and a6 power-law dependencies, respectively. The THz power in panels (a,b) is normalized to the incident field intensity. The dotted horizontal lines labeled signal and noise mark the experimental signal-to-noise ratio (SNR) corresponding to the simulated signal value at 20 μm aperture (red square). The vertical dotted line set the minimum aperture size limit for SNR > 1.

