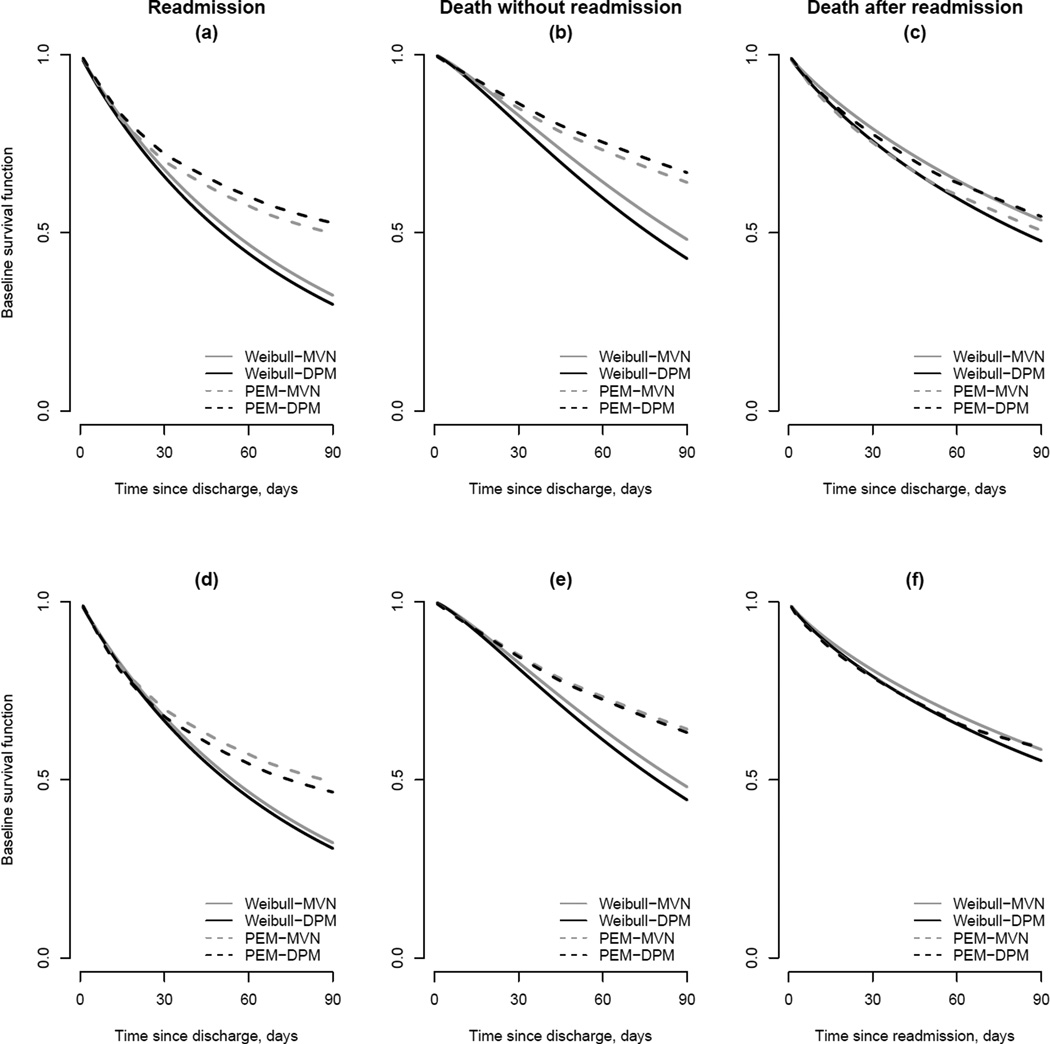
Figure 3.
Estimated transition-specific baseline survival functions, S0g(·) = exp(−H0g(·)), for the eight models fit to the New England Medicare data (see Table 7). Panels (a)–(c) are estimates based on a Markov specification for h03(·); panels (d)–(f) are estimates based on a semi-Markov specification. Note the difference in time scale between panels (c) and (d) due the differing specifications for h03(·).

