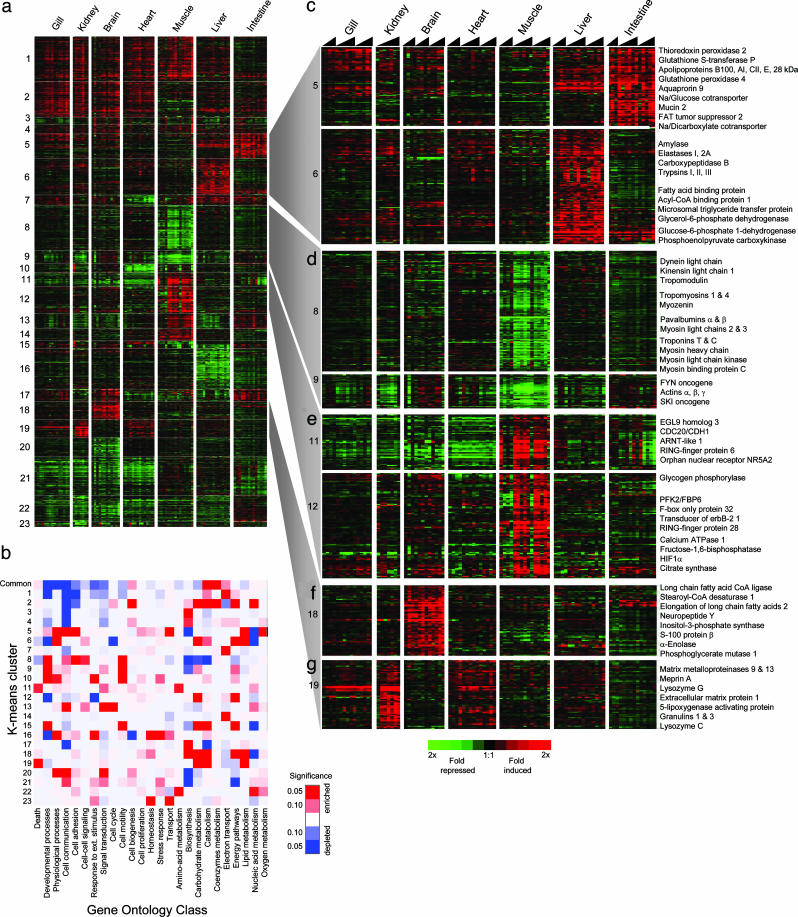
Fig. 3.
Variation in the expression of 1,728 cDNAs in tissues of cooled fish. The expression of each cDNA is presented as the ratio of transcript abundance in each cooled sample relative to its mean abundance in the control warm-acclimated samples. (a) Cluster diagram showing the 23 K-means clusters of cDNAs that exhibited similar expression profiles. (b) GO-Matrix chart, a pseudocolor map of the significant over- or underrepresentation (red or blue, respectively) of genes within the common response and each of the K-means clusters. Saturated colors represent P values of <0.05. Detailed views of selected clusters are as follows: liver and intestinal mucosa-induced cDNAs (c), muscle-repressed transcripts (d), muscle-induced transcripts (e), brain-induced transcripts (f), and cDNAs induced in kidney (g). Representative or notable genes found in these clusters are indicated.

