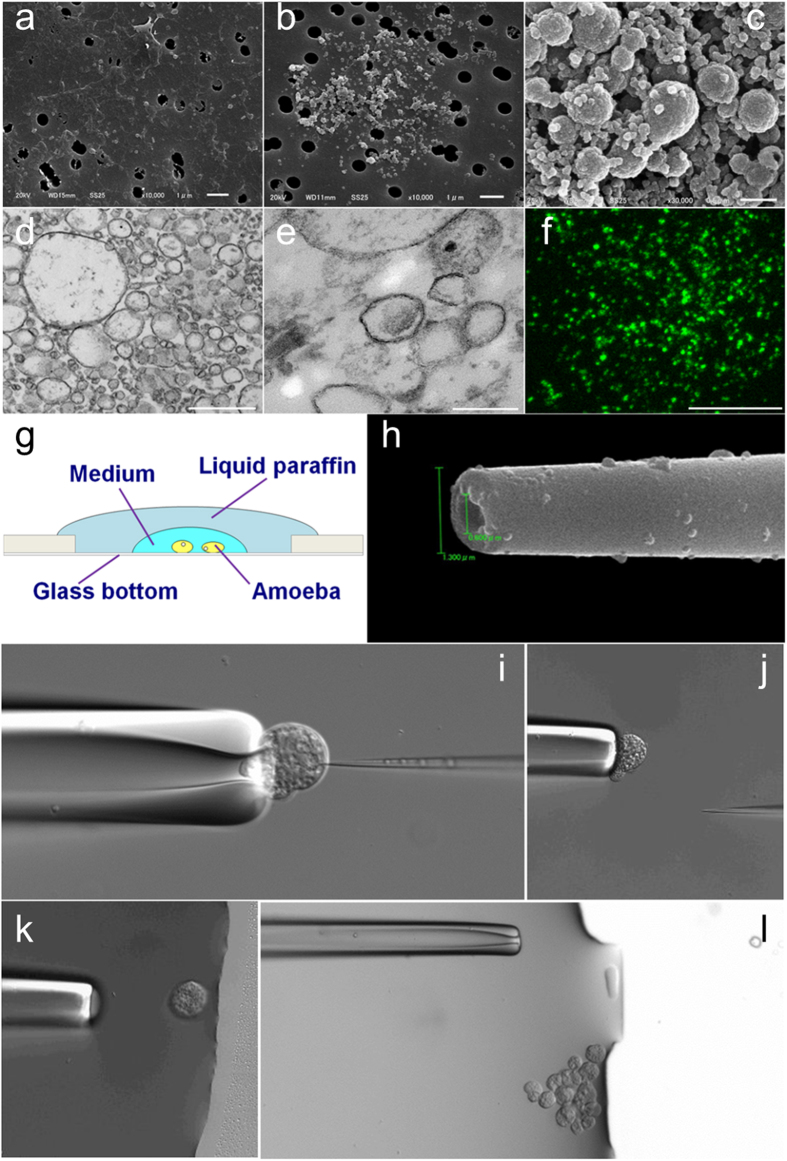
Figure 1. Microinjection of mitosomes into E. histolytica trophozoites.
Mitosomes were isolated by the Percoll-PLUS gradient method. (a) SEM image of the supernatant of cell lysate before gradient centrifugation. (b) SEM image of the mitosome fraction after gradient centrifugation. (c) SEM image of the fraction concentrated by centrifugation. (d–e) TEM images of concentrated fractions. (f) Fluorescence image of the concentrated fraction. Mitosomes with APSK-HA were stained using anti-HA-tag-Alexa Fluor 488. (g) Schematic illustration of the stage on the microinjection system. (h) SEM image of the tip of the injection capillary. (i–l), Time-lapse images during transplant of mitosomes (see Video S1). Bars indicate 1 μm in (a) and (b), 500 nm in (c) and (d), 200 nm in (e), and 10 μm in (f).

