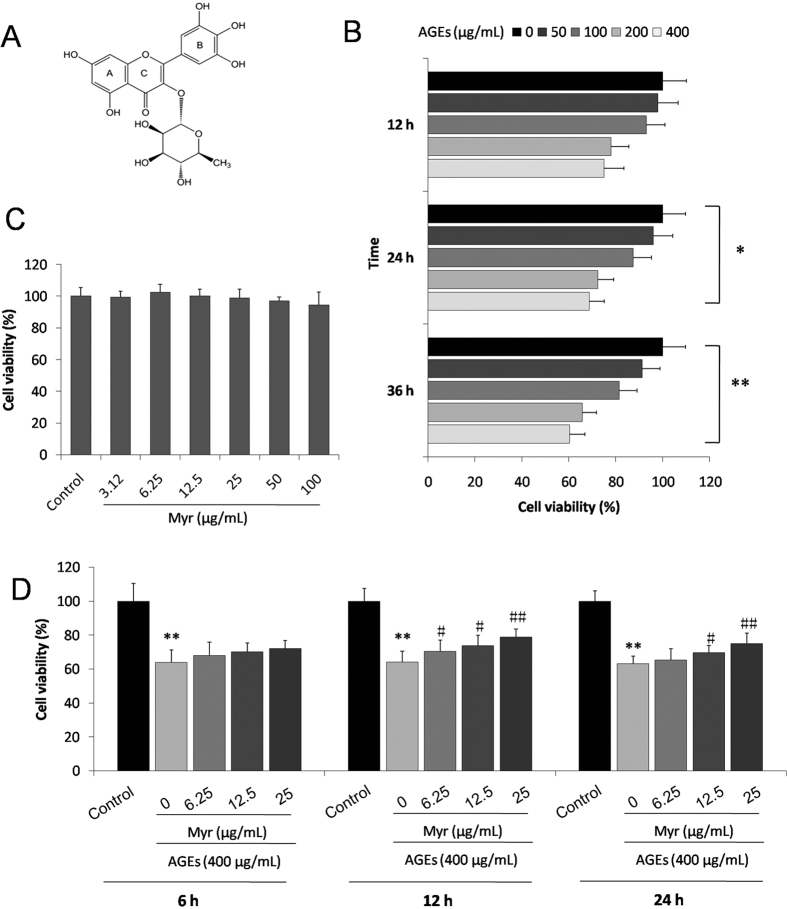
Figure 1. Myr attenuated H9c2 cell death induced by AGEs.
(A) Chemical structure of myricitrin. (B) Cell viability was assessed by the MTT assay. H9c2 cells were exposed to various concentrations of AGEs for 12, 24, and 36 h in the presence or absence (control) of myricitrin (C) The toxic effect of myricitrin on H9c2 cell viability was observed. (D) The protective effects of myricitrin on H9c2 cells exposed to AGEs (400 μg/mL). Values are represented as the mean ± SD. n = 9, *p < 0.05 and **p < 0.01 vs control group; #p < 0.05 and ##p < 0.01 vs AGEs group.

