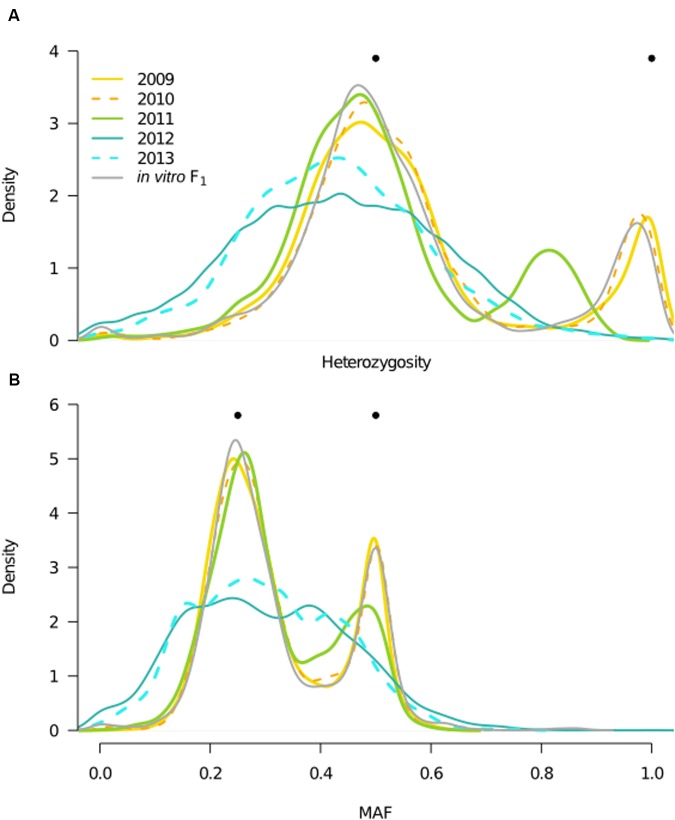
FIGURE 4.
Year heterozygosity and allele frequency (MAF) distributions. Filled, black circles indicate expectations for population heterozygosity and MAF in a theoretical F1 population. (A) Distributions of the proportion of heterozygous individuals per SNP (n = 6,916) for each year and the in vitro F1, represented by kernel density estimates, with color corresponding to year, and x-axis consistent with (B). Bimodal distributions in the in vitro F1 and years 2009–2010 are consistent with expectations for the F1 generation, whereas unimodal distributions in 2012–2013 indicate presence of inbreeding. A shift in the bimodal distribution of 2011, indicates the mixed outbred and inbred composition of this year. (B) MAF distributions, where the minor allele is defined based on the frequency in the total field population, for each year and the in vitro F1, with color designations the same as in (A).

