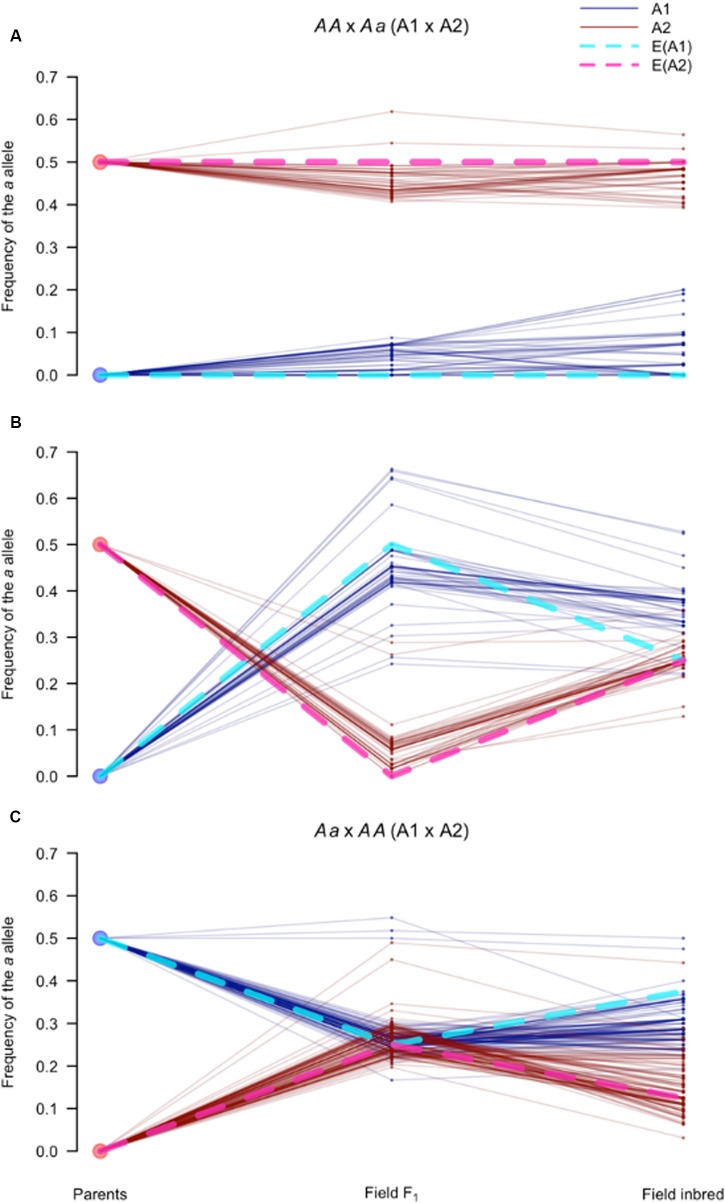
FIGURE 8.
Segregation of SNPs in the mating type region follow expectations for sex-linked loci. Frequency of the a allele (pa), for AA × Aa and Aa × AA (A1 × A2) markers in the mating type associated sub-regions of scaffolds 4 and 27, defined as the mating type region (MTR). Each parallel coordinate plot (A–C) tracks pa at three time points (parents, field F1, and field inbred) in the A1 (blue solid lines) and A2 (red solid lines) isolates for: (A) AA × Aa markers (n = 49) with pa> 0.3 in the A2 and pa < 0.3 in the A1 field F1 isolates; (B) Remaining AA × Aa markers (n = 49); and (C) All Aa × AA markers. Expectations for sex-linked loci, indicated by dotted lines, assuming the A1 and A2 mating types behave like the homogametic (light blue) and heterogametic (pink) sexes, respectively, when: (A) the a allele is in the A2 determining haplotype (i.e., Y analog); (B) the a allele is in the non-A2 determining haplotype (i.e., X analog); and (C) the a allele is in either of the non-A2 determining haplotypes (i.e., X analogs).

