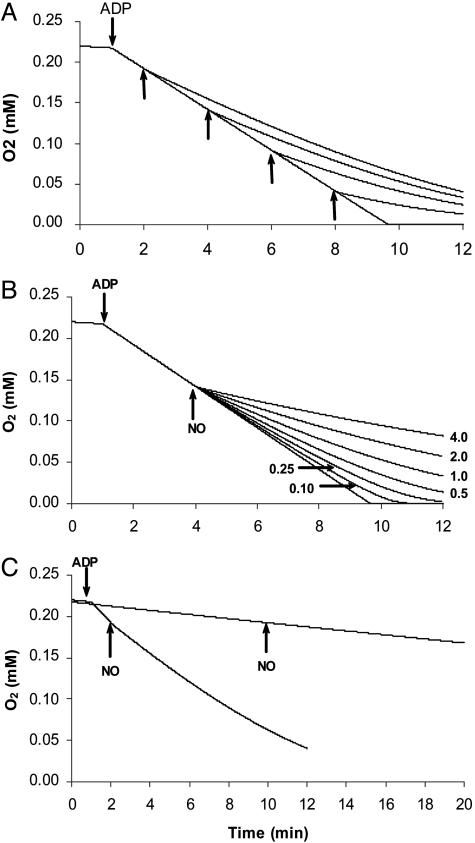
Fig. 1.
Simulation of typical experiments with isolated mitochondria on the inhibition of respiration by NO. (A) NO was added at 1 μM as indicated by the arrows. (B) NO was added at 4.0, 2.0, 1.0, 0.5, 0.25, or 0.10 μM at 4 min, when O2 concentration was 142 μM. (C) NO at 1 μM was added to respiration with high turnover (state 3-like) and with low turnover (state 4-like). Model 1 was used with the following parameters: COX initial concentration was 0.014 μM (at time 0 it was assumed that all COX was in the form Fea32+–CuB+), which is equivalent to 0.1 mg of mitochondrial protein per ml; O2 initial concentration was 220 μM; kNOon = 4 × 10⁷ M–1·s–1; kNOoff = 0.13 s–1; kO2app = 1.4 × 10⁸ M–1·s–1; kIV = 3 s–1 (to simulate state 4 respiration); and kIV = 30 s–1 (to simulate state 3 respiration). Transition between state 4 and state 3 is indicated by the addition of ADP.

