
Figure 7.
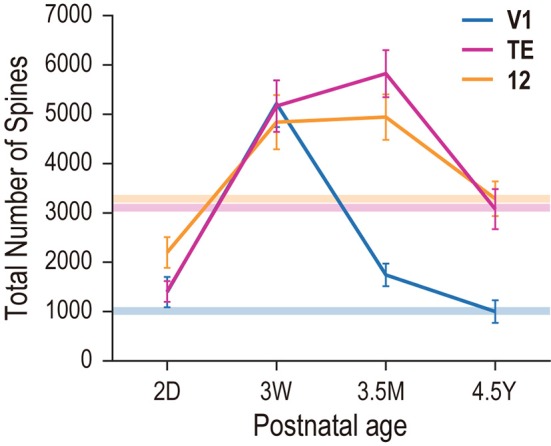
Total number of dendritic spines in the basal dendritic tree of the “average” cell in each cortical area and age. Horizontal bars with different colors indicate the adult levels for areas V1, TE, and area 12.
Official websites use .gov
A
.gov website belongs to an official
government organization in the United States.
Secure .gov websites use HTTPS
A lock (
) or https:// means you've safely
connected to the .gov website. Share sensitive
information only on official, secure websites.
Total number of dendritic spines in the basal dendritic tree of the “average” cell in each cortical area and age. Horizontal bars with different colors indicate the adult levels for areas V1, TE, and area 12.