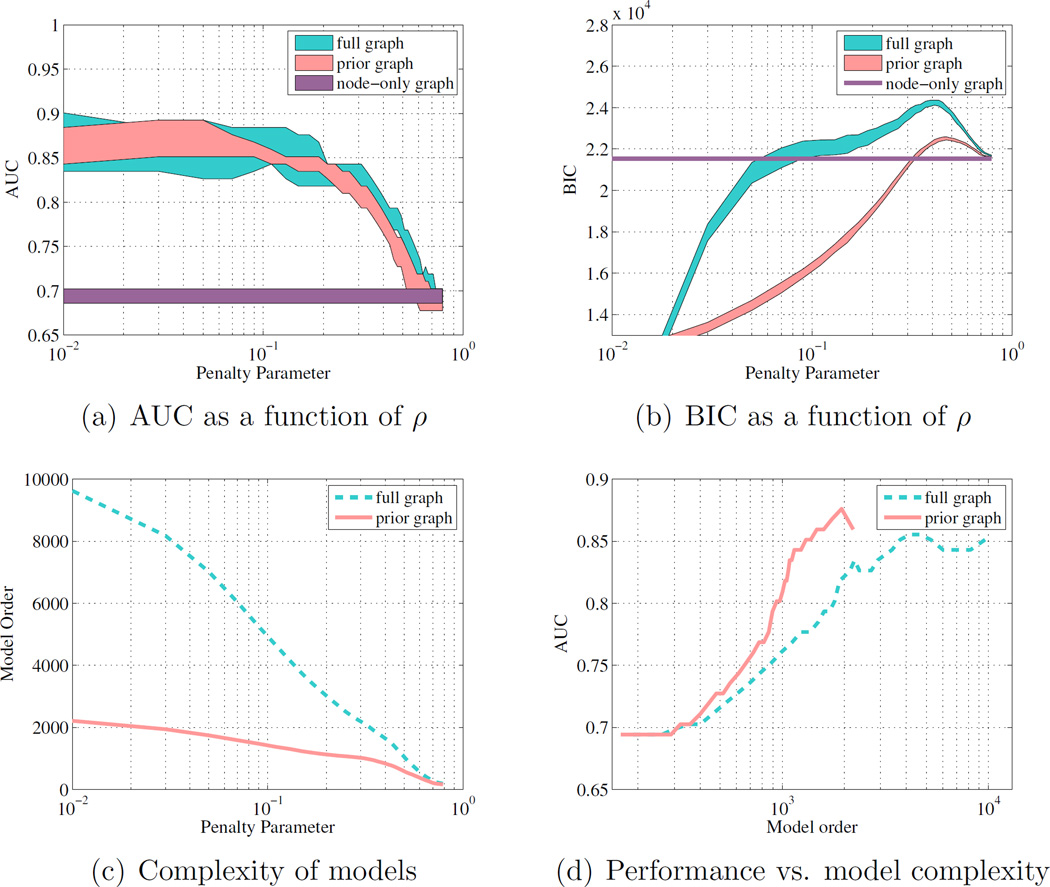
Figure 3.
(a) 90% CIs of the AUC, as a function of the penalty parameter ρ for the prior graph, fully-connected graph, and node-only graph; (b) 90% CIs of the BIC as a function of the penalty parameter ρ for each model; (c) Number of model parameters for a given penalty weight for prior and fully-connected graphs; (d) AUC as a function of the number of model parameters for the prior and fully-connected graphs. Both models show similar AUC performance, but the prior graph has better model complexity and BIC.

