Fig. 6.
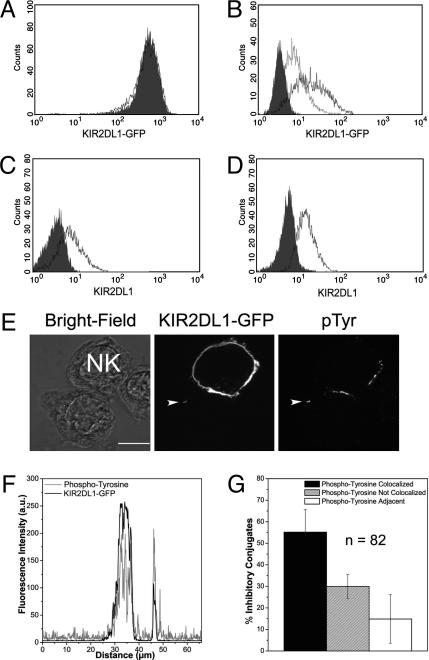
Orientation of transferred KIR and colocalization of transferred KIR with phosphotyrosine. (A) The fluorescence of KIR2DL1-GFP on the NK cell before (filled histogram) and after (black line) an acid wash. (B) Target cells that had acquired KIR2DL1-GFP (black line) were subjected to an acid wash (gray line). The filled histogram represents control acid-washed target cells. Acid-washed cells were stained with an isotype-matched control mAb (filled histogram) or anti-KIR2DL1 mAb (black line) under nonpermeabilizing (C) and permeabilizing (D) conditions. Results are representative of at least four independent experiments. (E) LSCM of YTS-TG conjugated to 221/Cw6 and stained for phosphotyrosine. (Scale bar, 8 μm.) (F) Fluorescence intensity around the target-cell membrane demonstrates colocalization of anti-phosphotyrosine staining (black line) with KIR2DL1-GFP (gray line) both at the synapse and at the patch of transferred KIR2DL1-GFP. (G) The location of anti-phosphotyrosine staining was scored in relation to transferred KIR2DL1-GFP in inhibitory conjugates. Shown is the frequency of colocalization in 82 conjugates. Mean and the SE from three different experiments are shown.

