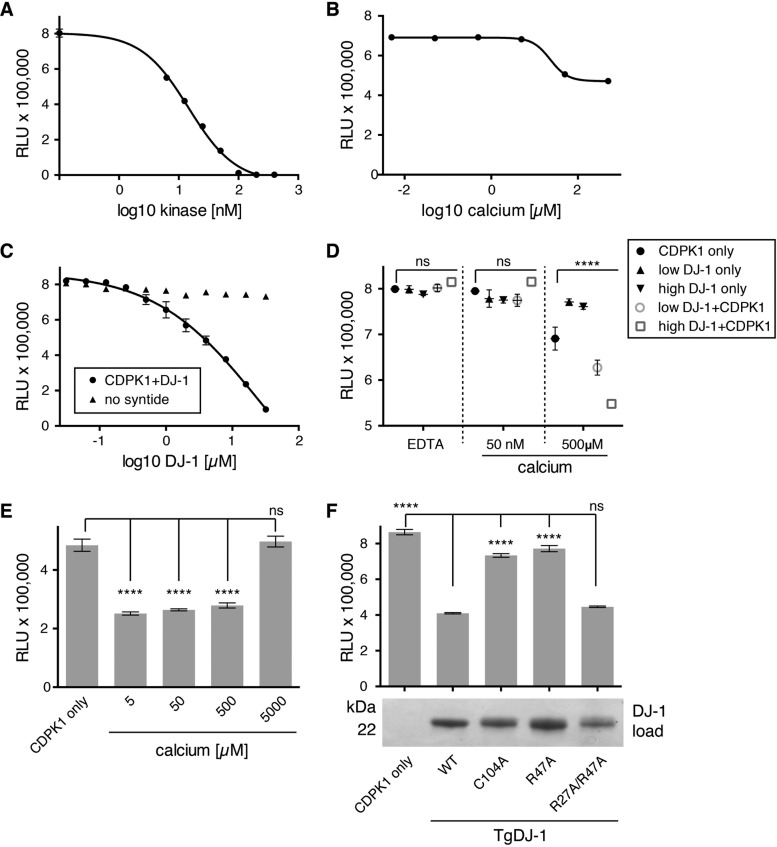
FIG 3 .
TgDJ-1 potentiates CDPK1 kinase activity, with the effect dependent upon, and synergistic with, calcium. (A) Kinase activity assay to optimize CDPK1 concentration. Scatter plot of data points from a kinase assay optimizing the concentration of CDPK1 kinase required to generate robust signal for 10 µM syntide and 10 µM ATP. (B) Kinase activity assay to optimize calcium concentration for CDPK1 activation. Scatter plot of data points from a kinase assay testing the concentration of calcium required to fully activate CDPK1. (C) Kinase activity assay testing the effect of TgDJ-1 upon CDPK1 activity. Scatter plot of data points from a kinase assay where TgDJ-1 was titrated against CDPK1, either in the presence (CDPK1+DJ-1) or absence of the peptide substrate (no syntide). (D) Kinase assay testing the effect of calcium on pre-complexed CDPK1+DJ-1. Scatter plot of kinase assay data points where CDPK1 alone (CDPK1 only), TgDJ-1 alone (DJ-1 only), or TgDJ-1+CDPK1 (DJ-1+CDPK1) was incubated with EDTA, 50 nM, or 500 µM calcium. Two concentrations of TgDJ-1 were used: 0.26 µM (low DJ-1) or 2.6 µM (high DJ-1). Significance was calculated for a two-way ANOVA statistical analysis (with Dunnett’s multiple comparison test) comparing each group of means (EDTA, 50 nM or 500 µM calcium) with the CDPK1 only control within the group. ns, not significant; ****, P ≤ 0.0001. (E) Kinase assay testing the effect of incubating CDPK1 with TgDJ-1 in the presence of a titration of calcium. Histogram of kinase assay data points for CDPK1 only, or TgDJ-1+CDPK1 pre-incubated with 5, 50, 500, or 5,000 µM calcium. Data presented are the means of three replicates, with error bars indicating ± SD. Significance was calculated for an ordinary one-way ANOVA statistical analysis (with Dunnett’s multiple comparison test) comparing each mean with the CDPK1 only control. ns, not significant; ****, P ≤ 0.0001. (F) Kinase assay testing the capacity of different TgDJ-1 mutants to potentiate CDPK1 activity. Histogram of kinase assay data points for CDPK1 alone (CDPK1 only), or CDPK1 incubated with 10 µM wild-type, C104A, R47A, or R27A/R47A mutant TgDJ-1 protein. Data presented are the means of three replicates, with error bars indicating ± SD. Significance was calculated for an ordinary one-way ANOVA statistical analysis (with Dunnett’s multiple comparison test) comparing each mean with wild-type TgDJ-1 (WT). ns, not significant; ****, P ≤ 0.0001. The panel beneath the histogram is a Coomassie stained gel indicating equal input of the different TgDJ-1 mutant proteins in the kinase assay reactions. For panels A, B, C, and D, data presented are the means of three replicates, with error bars indicating ± SD. RLU, relative light units.

