FIG 5 .
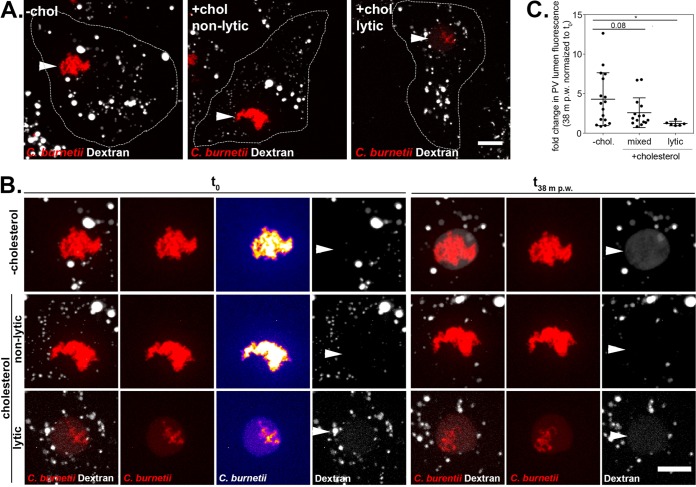
Lytic PVs are nonfusogenic. (A and B) Representative microscopy images showing increased dextran accumulation in the lumen of PVs from MEFs grown in cholesterol-free media (−chol) compared to cells grown in media with cholesterol (+chol). The cells are outlined in white in panel A, while panel B shows 2.5× insets of the PV and surrounding cytoplasm from panel A. MEFs infected with mCherry-expressing C. burnetii were pulsed with fluorescent dextran for 10 min, washed with media to remove noninternalized dextran, followed by imaging of PVs every 6.3 min for 38 min. C. burnetii bacteria are shown in red, and dextran is shown in white. The maximum z-axis projections are shown. Bars = 10 µm. In the t0 C. burnetii column in panel B, the C. burnetii image was mapped to an intensity lookup table to visualize the lytic phenotype, with blue depicting the lowest fluorescent intensity and yellow showing the highest intensity. Note the presence of red fluorescence in the PV lumen of the lytic PV. PVs are indicated by white arrowheads. The images were processed identically, and the gamma was increased to 1.5 to more easily visualize PV dextran. (C) The fold change in total PV lumen dextran fluorescence intensity at the end of the time course versus time zero (t0) for the volume at 38 min postwashing (38 m p.w.). Each circle indicates the value for an individual PV, and the means ± standard deviations of the means for groups of PVs are shown. Statistical significance was determined by an unpaired t test and indicated as follows: *, P < 0.05.

