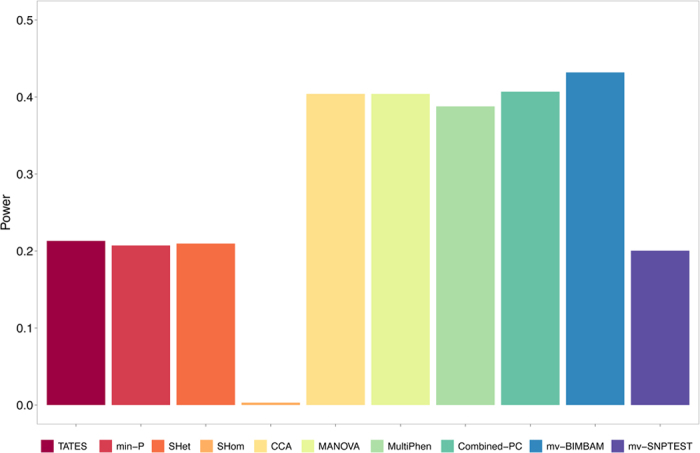
Figure 5. Power of methods in real data informed simulations with 12 traits.

Power comparisons for the real data informed simulations of scenario 4b (S4b) involving 12 phenotypes. In this scenario both genetic effects and corresponding phenotypic correlations are drawn directly from real data on the same set of traits. All other results for this scenario are shown in Supplementary Figure 13.
