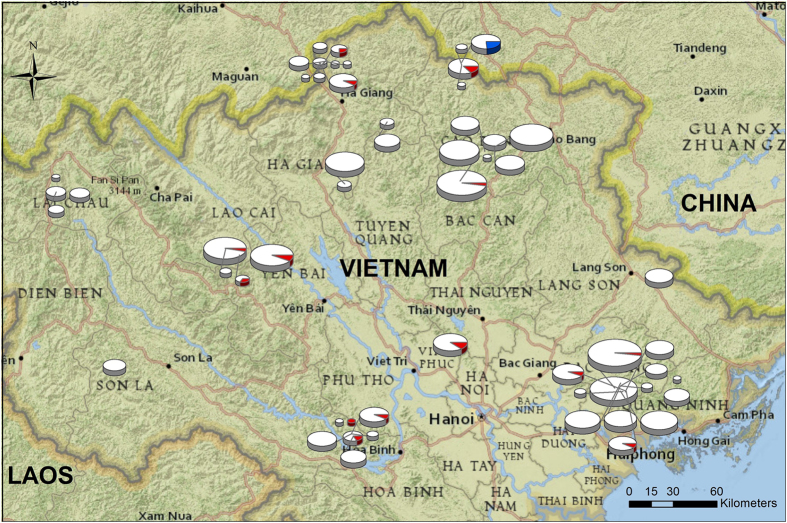
Figure 1. Map of sampling locations within Northern Vietnam.
The size of the pie charts corresponds to the sample size ranging from 1 to 44 individuals. The pie chart indicates the prevalence of Bsal (Red) or Bd (Blue) within that population. This map was generated in ArcMap 10.1 (http://www.esri.com/software/arcgis/arcgis-for-desktop).

