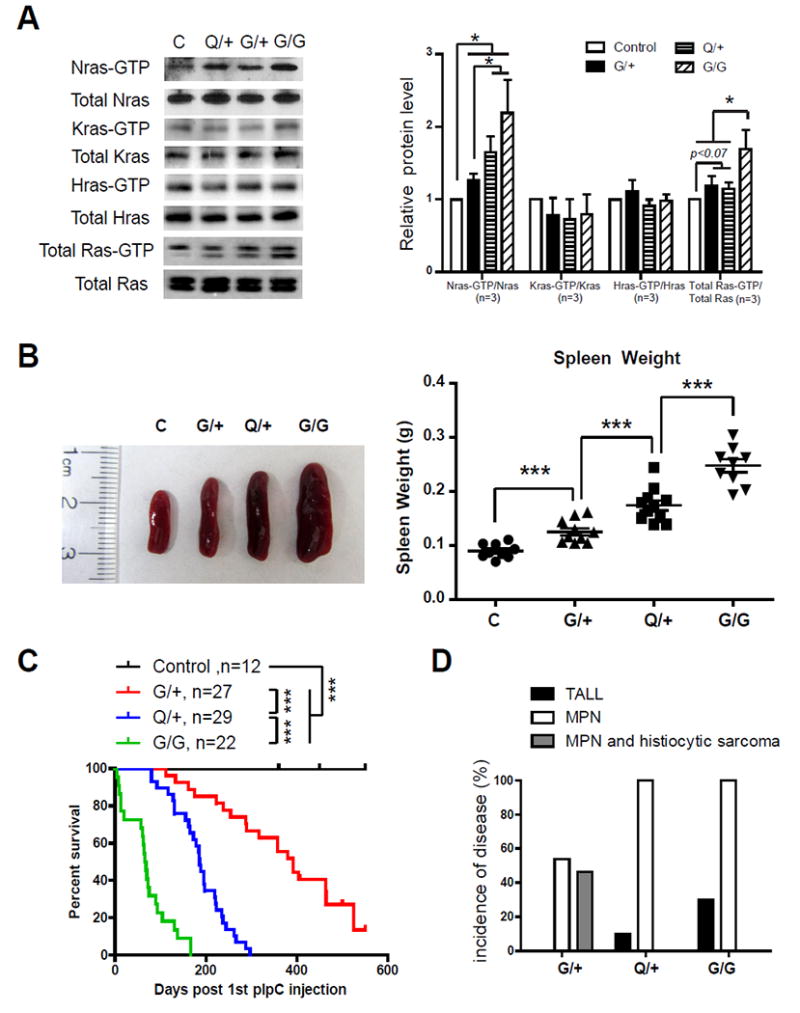
Figure 1. Somatic activation of NrasQ61R/+ leads to intermediate leukemia phenotypes between NrasG12D/+ and NrasG12D/G12D.

(A, B) Six-seven weeks old control (C), NrasG12D/+ (G/+), NrasQ61R/+ (Q/+), and NrasG12D/G12D (G/G) mice were injected with pI-pC and sacrificed on Day 5 for analysis as described in Methods. (A) Whole cell lysates were extracted from total bone marrow cells and assayed for expression levels of different Ras isoforms. Ras-GTP was affinity purified from WCL using a GST fusion with the Ras binding domain of Raf (Raf RBD) immobilized on agarose beads. Different Ras isoforms and total Ras bound with GTP were analyzed using Western blot analyses. The results were quantified using ImageJ software. The ratios of Ras-GTP/Ras in control cells are arbitrarily set at 1. (B) Quantification of spleen weight. (C) Kaplan-Meier survival curves were plotted against days after 1st pI-pC injection. P values were determined using the Log-rank test. (D) Disease incidences of moribund mice. The results are presented as mean ± SD. * P<0.05; *** P<0.001.
