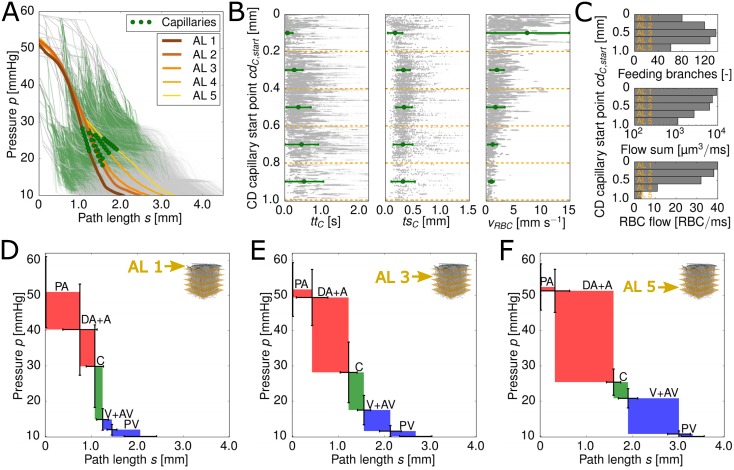
Fig 3. Pressure drop along the pathway of red blood cells (RBCs) and layer-specific flow characteristics.
(A) Averaged pressure curves for the five analysis layers (ALs) (thick lines). The average locations of the capillaries are marked by green circles for each AL. The thin curves in the background represent the raw data and the thin green shading highlights the location of the capillaries for the raw data. (B) Capillary transit time ttC, transit path length tsC and RBC velocity vRBC for the five ALs (green symbols and error-bars, mean ± standard deviation). The scatter plot in the background shows the raw data for all MVNs studied. (C) Feeding properties for the five ALs. From top to bottom: (i) Number of feeding branches for the capillary bed, (ii) sum of blood flow rate through the feeding branches and (iii) sum of RBC flow rate through the feeding branches. (D),(E) & (F) Averaged pressure drop and averaged path length for different vessel types. The color coding facilitates the differentiation between arterioles (red), capillaries (green) and venules (blue). The standard deviation for the averaged pressure at the start of the different vessel types is given by the vertical error bars. The horizontal error bars represent the standard deviation for the averaged path length for the different vessel types. Fig (D),(E) and (F) show the averaged results for all RBCs with a capillary start point in AL 1, AL 3 and AL 5, respectively. PA: pial atery, DA: descending arteriole, A: arteriole, C: capillary, V: venule, AV: ascending venule, PV: pial vein

