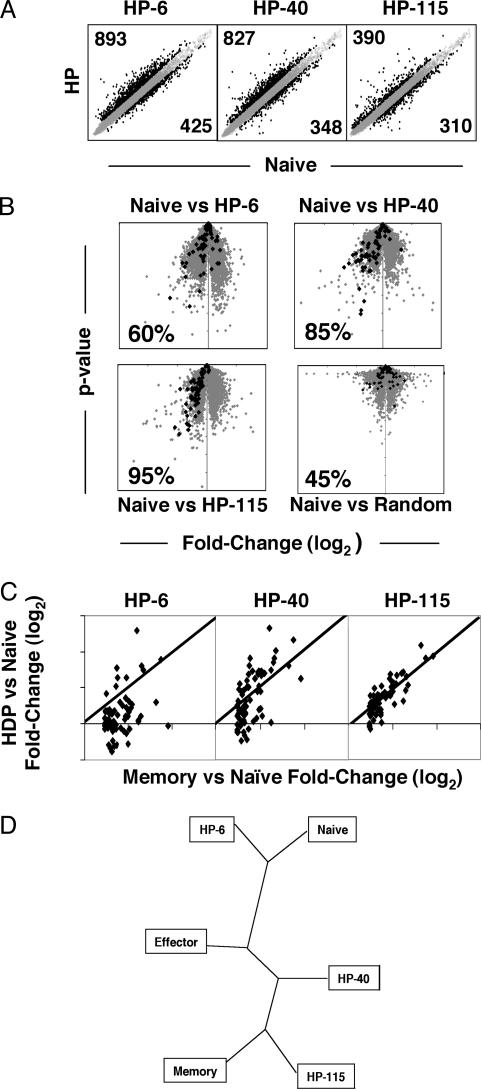
Fig. 4.
HP leads to expression of memory-specific genes. (A) Log-scale plots of normalized and averaged expression for HP at days 6, 40, and 115 versus normalized and averaged expression of naïve replicates. Genes expressed >1.5-fold higher or lower than naïve are highlighted in black. (B) Fold-change (log2) versus P value plotted for the comparison of HP over a time course compared to naïve. Genes highlighted in black indicate expression relative to naïve for memory-specific genes (genes up-regulated in memory 1.3-fold over naïve with a P value <0.01, but not up-regulated in effector versus naïve). The percentage of memory-specific genes also up-regulated for the indicated population compared to naïve is given for each plot. (C) For the memory-specific gene list, fold-change (log2) values for the indicated HP population compared to naïve are plotted versus the fold-change (log2) values for memory compared to naïve. (D) Representation of the relationship of the indicated populations established by unsupervised hierarchical clustering illustrated as an unrooted phylogenic tree.

