
Fig. 2.
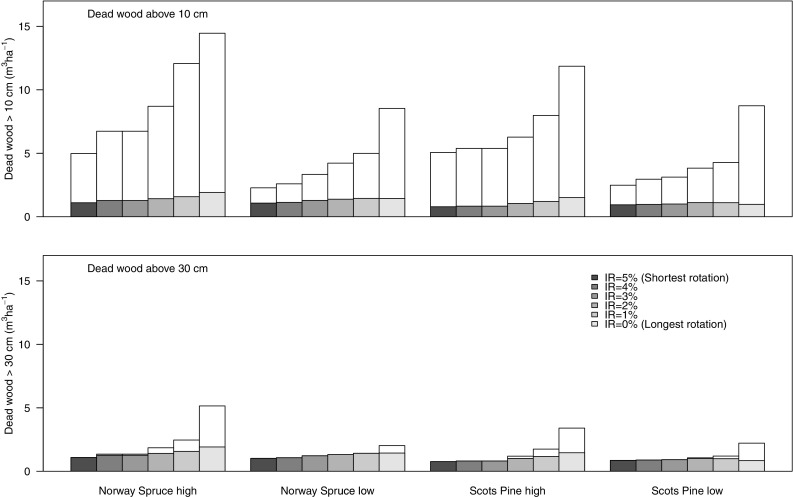
Mean amount of dead wood (m3 ha−1) in the form of dead trees above 10 cm (top) and 30 cm (bottom) in diameter. The total bars represent all dead wood (including the contributions of both production trees and retention trees), and the lower dark part of the bars represents dead wood originating from retention trees. Dead wood was calculated as an average for simulations with even age distribution of stands of Norway spruce (NS) or Scots pine (SP) in two site productivity classes (high and low) with optimal management according interest rates (IRs) varying between 0 and 5%. The different IRs were used in order to achieve a gradient in rotation length from the shortest rotation for IR = 5% to the longest for IR = 0% (see Table 1 for details)