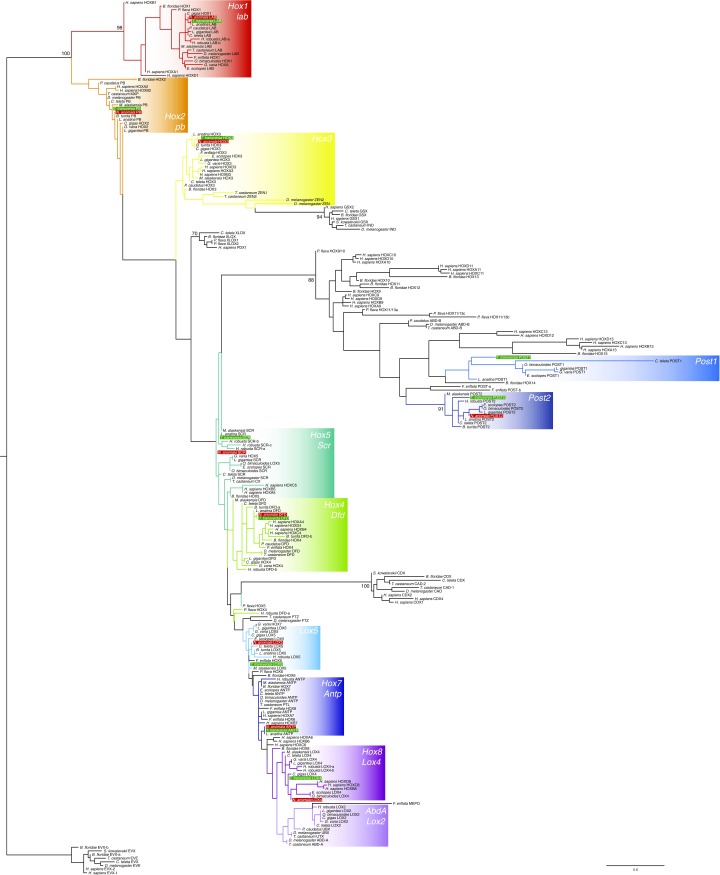
Fig. S1.
Orthology analysis of T. transversa and N. anomala Hox genes. Maximum likelihood phylogenetic analysis of bilaterian Hox and ParaHox genes, using as outgroup the even-skipped (EVX) subfamily. Colored boxes indicate Hox ortholog groups present in spiralian representatives. Hox gene sequences of a representative selection of bilaterian lineages (Table S1) were aligned with MAFFT v.7. The multiple sequence alignment (available on request) was trimmed to include the 60 amino acids of the homeodomain. ProtTest v.3 was used to determine the best-fitting evolutionary model (LG+G+I). Orthology analyses were conducted with RAxML v.8.2.6 using the autoMRE option. T. transversa sequences are highlighted by green boxes; N. anomala sequences, by red boxes. Only bootstrap values of at least 70 at nodes that supposedly represent distinct orthology groups are shown. High support values within orthogroups (e.g., between paralogs) were omitted for the sake of clarity.

