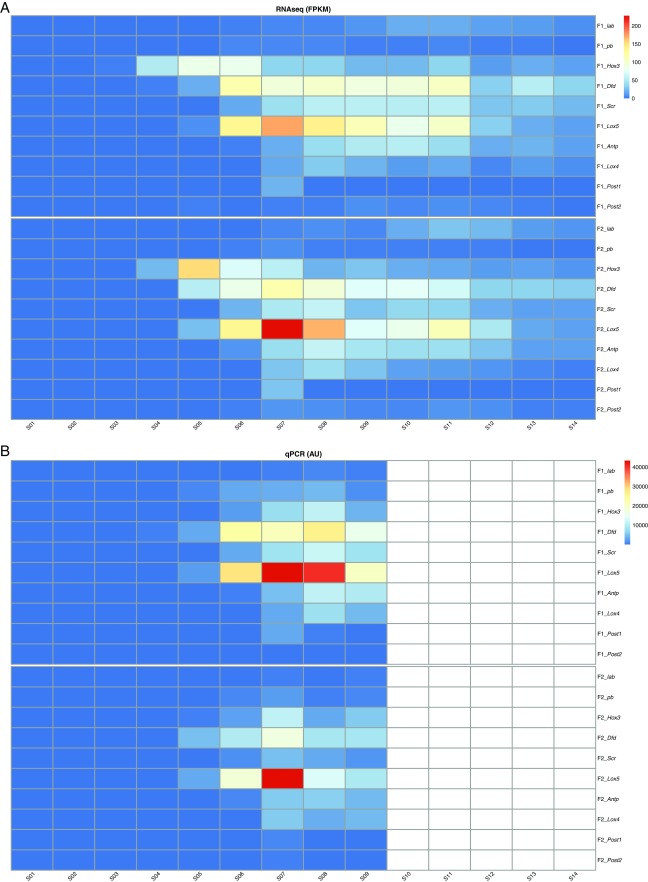
Fig. S2.
Quantitative expression of Hox genes in T. transversa developmental stages. For comparative stage-specific transcriptomic analyses, total RNA was used for constructing Illumina single end libraries and sequenced in four lanes of a HiSeq 2000 platform. Samples were randomized among the lanes. To estimate the abundance of transcripts per stage, we mapped the single end reads to the transcriptome of T. transversa with Bowtie, calculated expression levels with RSEM, and generated a matrix with TMM normalization across samples by running Trinity’s utility scripts. For real-time qPCR, total RNA was DNase-treated and preserved at −80 °C. Gene-specific primers bordering an intron splice site and defining an amplicon of 80–150 bp were designed for each gene (Table S2). Expression levels of two technical replicates performed in two biological replicates were calculated based on absolute quantification units. (A) RNAseq expression levels calculated by fragments per kilobase of exon per million reads mapped (FPKM). As shown by whole-mount in situ hybridization, Hox3 is the first gene up-regulated in the two biological replicates (female 1, F1; female 2, F2). The Hox genes pb and Post2 are detected at low levels compared with other Hox genes, which obscures their temporal variation during development in the heat map. (B) Real-time qPCR expression levels based on absolute quantification units (AU). PCR was not performed for stages 10–14 (white cells). qPCR confirmed the absence of temporal collinearity, although higher levels of Hox3 were not detected at late blastula (S04), as observed by RNAseq and in situ hybridization, likely owing to technical issues with the qPCR. Stages: S01, oocytes; S02, 8 h mid blastula; S03, 19 h late blastula; S04, 24 h moving late blastula; S05, 26 h early gastrula; S06, 37 h mid gastrula; S07, 51 h late gastrula; S08, 59 h bilobed late gastrula; S09, 68 h trilobed late gastrula; S10, 82 h early larva; S11, 98 h late larva; S12, competent larva; S13, 1 d juvenile; S14, 2 d juvenile. Expression levels obtained by real-time qPCR and comparative stage-specific transcriptomics were plotted with R.

