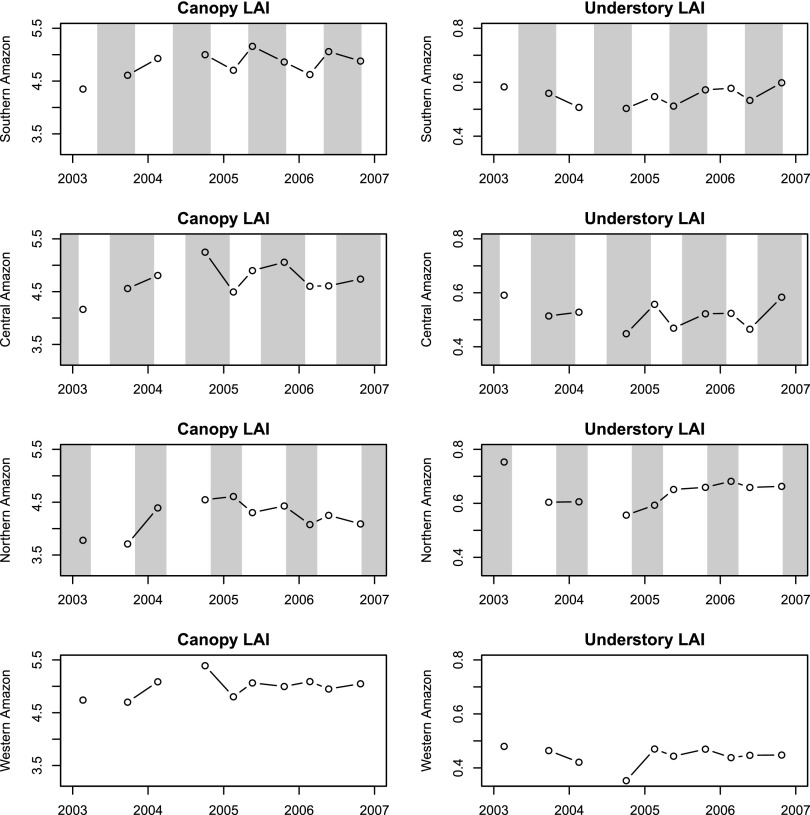
Fig. S3.
Canopy and understory LAI changes in sequential GLAS acquisition campaigns at different climate zones. Each point represents the averaged LAI value of GLAS footprints falling within a climate zone, and is placed at the starting date of each observation campaign (Note there were no reliable May to June GLAS observations in 2003 and 2004; Table S2). The shaded areas indicate approximate dry seasons for different climate zones as identified in Fig. S2 (the actual duration of dry season can vary spatially and temporally). The multiyear LAI changes aggregated from footprint level measurements show that canopy LAI largely increases from the middle of wet season to the wet-to-dry transition period, and that understory LAI increases within the dry season mostly. These results are consistent with seasonal patterns revealed at 1° cell resolution (Table 1), suggesting no major systematic sampling error at this resolution.

