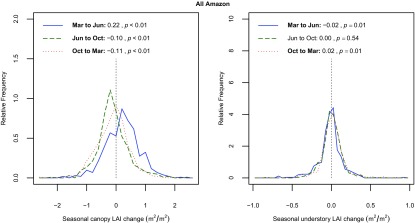
Fig. S5.
Seasonal 1° mean canopy LAI change and understory LAI change over the entirety of Amazon evergreen forests. A Welch’s t test was performed to examine whether the LAI change is different from 0 (seasons with P <0.05 have their legend item in bold). The magnitude of changes, for both canopy and understory LAI, is smallest from June to October because the direction of change in some regions (e.g., the southern vs. the rest of Amazon) is reversed during this period (Figs. S4 and S6).

