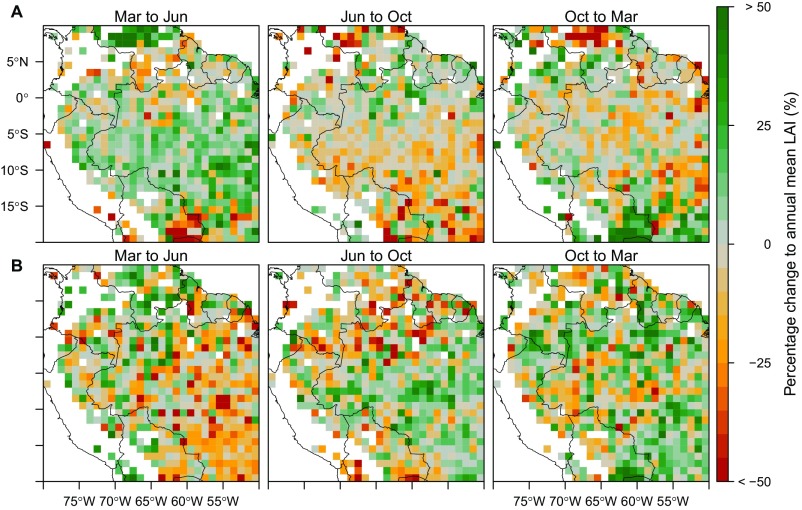
Fig. S8.
Seasonal percentage change of canopy LAI (A) and understory LAI (B) within and outside the Amazon river basin. The percentage is calculated as the change of LAI divided by the annual mean of canopy LAI (or understory LAI) at each cell. Within the basin area (Fig. 1), the magnitude of percentage change is higher in understory (with many pixels exceeding 50%) than the canopy layer (generally <10%). Dry forests and savannas outside the Amazon river basin also show seasonal dynamics of canopy and understory LAI, but mostly in a synchronous mode that greens through the wet season and browns during the dry season. These areas include northern Colombia, western Venezuela, northern Bolivia, and the southern Mato Grosso province of Brazil.

