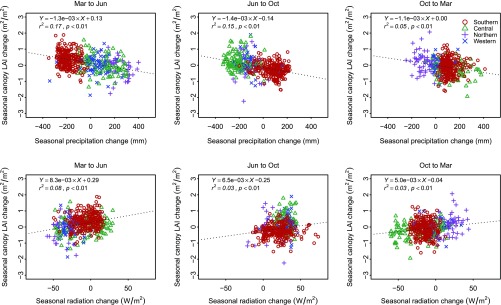
Fig. S9.
Relationships between canopy LAI change and changes of climate variables for all 1° cells. Their relationships (negative correlation with changes of precipitation and positive correlation with changes of radiation) are consistent with previous studies (8, 11). The dotted line is generated using an ordinary least-squares model.

