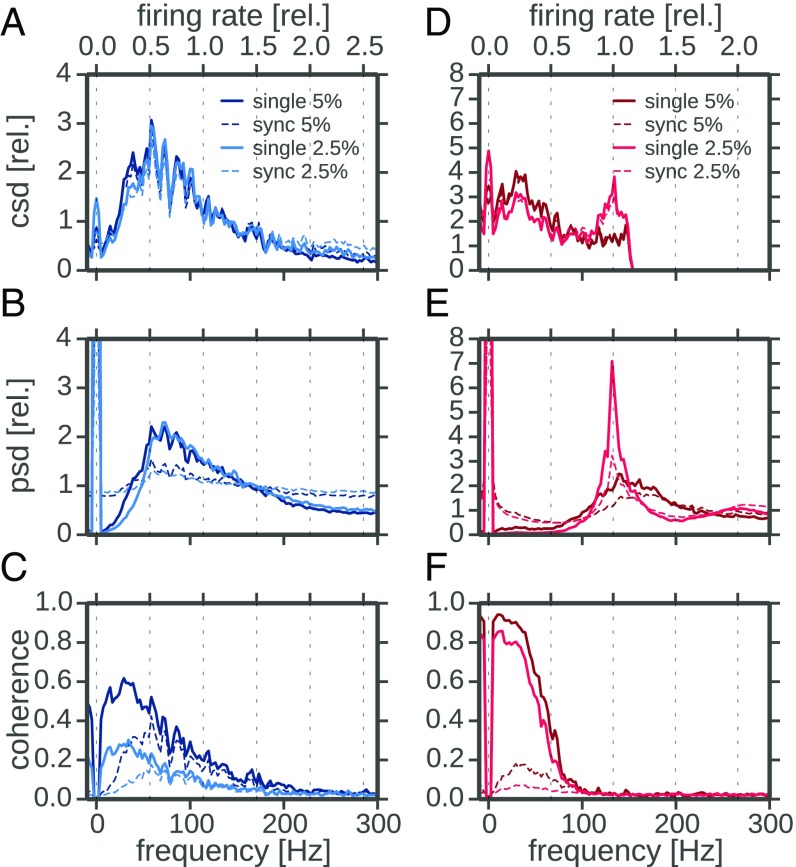
Fig. 5.
Comparison of response spectra of P-type and ampullary afferents. (A–C) Cross-, power, and coherence spectra of an example P unit (2012-03-23-ae). In each panel the respective spectra of the single trials (solid lines) and the synchronous responses (dashed lines) at two different stimulus intensities (contrast; Materials and Methods) are depicted. All spectra were calculated from response segments of 8,192 points (∼0.41 s) width with 50% overlap. Hanning windows were applied to each segment. Segments were not detrended, leading to the large 0-Hz power. Cross- and power spectra are normalized to their average in the frequency range from 10 Hz to 150 Hz for easier comparison of the shape. The second frequency axis on top is scaled according to the baseline firing rate. (D–F) Same analysis for an example ampullary afferent (2012-03-23-ad). Cells were selected to allow for a comparison at the same two stimulus intensities. csd, cross-spectral densities; psd, power-spectral densities; rel, relative.

