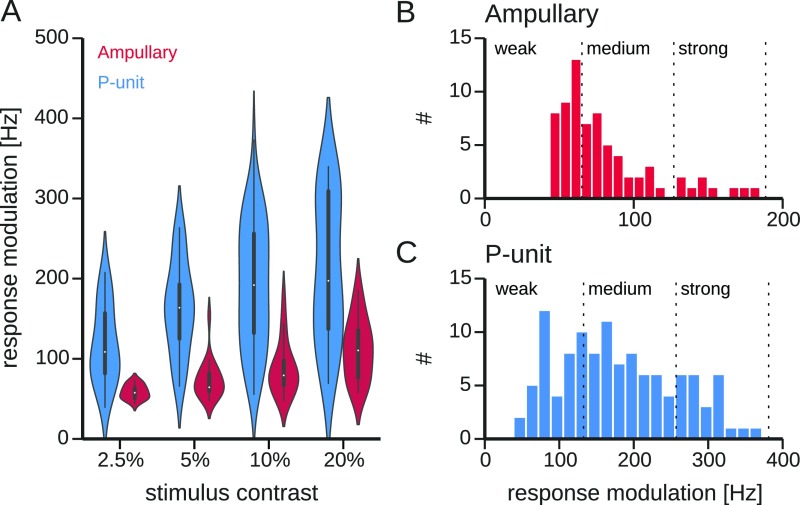
Fig. S1.
Relation of response modulation and stimulus contrast. (A) Neuronal responses of ampullary and P-unit electroreceptors were evoked by stimuli of four different contrasts, i.e., standard deviations of the random AM stimuli relative to the EOD amplitude measured by the local electrode. Violin plots show the distributions of the resulting response modulations for the different stimulus contrasts for both cell types. The response modulation, Eq. 4, is the SD of the PSTH over time. High modulations indicate a high gain with which the cell responds to the stimulus. Within the violins, a boxplot indicates median, interquartile range, and 10% and 90% percentiles. (B and C) Distributions of observed response modulations for ampullary electroreceptor afferents and P units, respectively. The full range of response modulations is divided into three categories (weak, medium, and strong responses, vertical dashed lines). Because many cells were stimulated with stimuli of different contrasts, individual cells can contribute to more than one category.

