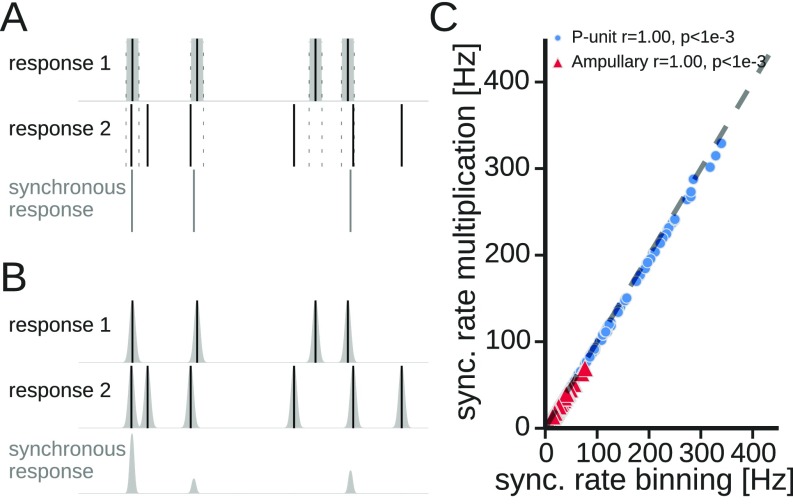
Fig. S2.
Computation of the synchronous response of pairs of responses. (A) Binning method: The spikes of response 1 (solid vertical lines indicate the occurrence of each spike) were convolved with a box kernel. If a spike of response 2 fell into the box of the first response, a spike in the synchronous response (bottom trace) was noted between the spikes of response 1 and response 2. (B) Multiplication method: Spikes of both responses were convolved with Gaussian kernels. The synchronous response is obtained by multiplying both responses. (C) Comparison of the mean synchronous response (comparable to the average rate of synchronous spikes) estimated with both methods. Data show results from both types of electroreceptors analyzed in this study. Dashed line is the bisecting line. “r” values in the key represent Pearson’s correlation coefficient. sync, synchronous.

